Kubernetes Resource Optimization

Kubernetes Resource Optimization Guide

Running containerized applications on the Kubernetes platform offers numerous advantages: It eases scaling, simplifies deployments, and provides self-healing capabilities. However, improper configurations can lead to resource overconsumption and can impact application performance, so Kubernetes resource optimization is fundamental for getting the most out of containerized applications.

In this article, we discuss various techniques for resource optimization. Resource optimization helps reduce infrastructure costs and can improve overall application performance. Proper optimization allows the cluster to scale effectively and maintain stability by avoiding resource conflicts.

Summary of key Kubernetes resource optimization concepts

Concept Description
Fundamentals of resource allocation Resource allocation controls, such as container requests and limits, help optimize overall resource usage.
Understand resource consumption There is a balance between over and under-provisioning CPU and memory resources. Missing the balance can lead to CPU throttling or the OOM Killer terminating processes.
Scaling strategies for optimal resource usage Autoscaling reduces costs by scaling only when needed. This section covers autoscaling strategies such as HPA, VPA, and Cluster auto-scaler.
Ensure pod health and availability Maintaining healthy pods ensures the application’s availability. For example, pod disruption budgets can prevent unintended terminations, and readiness/liveness probes monitor pod health to bolster application reliability.
Enforce resource constraints for namespaces Use resource quotas and limit ranges to limit the aggregate resources on a per-namespace level.
Optimizing resource allocation Application profiling helps identify inefficient pods. Features like node affinity/anti-affinity, node selectors, pod priority, and quality of service classes help match workloads to optimal nodes.
Monitoring and Optimization Tools Monitoring tools provide insights into resource utilization, cost, and application performance. This enables you to identify inefficiencies and take proactive measures.

Fundamentals of resource allocation

CPU and memory are the two most important resources you can manage on your cluster. You can manage CPU and memory allocation by setting resource requests and resource limits on a per-container basis.

  • Requests: This is the minimum CPU or memory required to run your container. Based on this setting, Kubernetes schedules a pod to a node with sufficient resources.
  • Limits: The maximum amount of CPU or memory the container can allocate before CPU throttling of Out-Of-Memory (OOM) errors starts impacting application performance. Kubernetes tries to ensure the container does not exceed this limit.

Defining a container's requests and limits allows the Kubernetes scheduler to decide better where to place pods. It matches pod needs with node capacity, efficiently utilizing available resources.

These are fundamental to resource allocation because by setting these resource controls, you can better manage resources so that no one or two containers overrun the entire system because they use too much memory or CPU.

Here is an example of how container requests and limits are defined in a pod spec.

apiVersion: v1
kind: Pod
metadata:
  name: frontend
spec:
  containers:
  - name: app
    image: images.my-company.example/app:v4
    resources:
      requests:
        memory: "64Mi"
        cpu: "250m"
      limits:
        memory: "128Mi"
        cpu: "500m"

Understand resource consumption

Understanding your resource utilization will help prevent the overprovisioning or underprovisioning of your pods, optimizing your overall performance.

Let's dive more into the nuances of provisioning these resources.

CPU utilization

One CPU core is equal to 1000 millicores (1000m). You can define your limits based on the core or 1/1000th of a core. When you configure limits on a container, if the utilization is above the set CPU limits, Kubernetes automatically limits the CPU allocation to the container and slows down the application response time. This behavior is called CPU throttling and is a safety valve to prevent one container from utilizing all the CPU available in the node. Configuring proper CPU limits helps achieve smooth and efficient application performance.

Memory utilization

A good memory-to-CPU allocation ratio is between 1:1 and 4:1. For example, if you request 250 CPU millicores, your memory should be between 250 MB and 1 GB.

Memory-heavy applications will try to utilize all the memory in the node, resulting in out-of-memory issues (OOMKilled events). This means processes will be killed off to try and save the system.

You want to focus on optimizing your requests and limits because, unlike CPU, which can fluctuate, once a process consumes memory, it rarely lets it go.

Over/Under Provisioning

Managing resource consumption is a balance between over and under-provisioning your resources to pods.

When a pod is over-provisioned, requests for resources are set too high; this takes away from the overall available resources since the Kubelet reserves these resources when it schedules a pod to a node. When none of the nodes have enough resources to meet the requests, the pod remains unscheduled until it can find a suitable node.

When a pod is under-provisioned, the limits are lower than the application needs. This can trigger CPU throttling to limit access to CPU resources or an OOM Killer to kill off processes.

Both over and under scenarios are sub-optimal, so optimizing resource utilization requires finding the balance between the two.

The example below shows current CPU and memory utilization on a per-container basis.

$ kubectl top pod --all-namespaces --containers  --sum  | head
NAMESPACE   POD                     NAME         CPU(cores) MEMORY(bytes)   
default     example-deployment-1    container1   1m         4Mi             
default     example-deployment-2    container2   2m         8Mi             
default     example-deployment-3    container1   0m         4Mi             
default     example-deployment-4    container2   2m         8Mi                


You can monitor and note changes in this usage over time to adjust your resource requests, or as we will see in the next section, we can gradually use auto-scaling to adjust these settings over time.

Scaling strategies for optimal resource usage

Scaling strategies help to control costs and promote availability by adding or adjusting resources only when needed. Auto-scalers can help you find the sweet spot for optimal application performance.

We discuss three types of autoscalers below: the horizontal pod autoscaler, the vertical pod autoscaler, and the cluster autoscaler.

Horizontal Pod Autoscaler (HPA)

The HPA is a Kubernetes object that automatically scales the number of pods in a deployment based on predefined target metrics and scaling policies set by a cluster administrator. It improves application performance by ensuring efficient resource usage by redistributing traffic among more pods.

HPA works by setting target metrics and defining scaling policies. It monitors the target metrics and automatically scales the pod count up or down to maintain the desired threshold level.

Before using HPA, you must set requests/limits on your containers and install the Kubernetes metrics server to get resource usage reporting from pods.

Here is a sample spec to define an HPA. In the snippet below, if the average CPU utilization of the pods in the Deployment goes above 50%, the HPA will trigger scaling up the deployment by creating additional pods. Conversely, if the average CPU utilization drops below 50% for a sustained period, the HPA might scale down the deployment by terminating some pods (depending on the HPA configuration).

apiVersion: autoscaling/v2
kind: HorizontalPodAutoscaler
metadata:
 name: php-apache
spec:
 scaleTargetRef:
   apiVersion: apps/v1
   kind: Deployment
   name: php-apache
 minReplicas: 1
 maxReplicas: 10
 metrics:
 - type: Resource
   resource:
     name: cpu
     target:
       type: Utilization
       averageUtilization: 50

By monitoring the actions of the HPA, you can better understand how to optimize your settings. If you notice you are frequently scaling up but rarely scaling down, you should increase the number of replicas in your deployment and plan for those resources to be used.

Comprehensive Kubernetes cost monitoring & optimization

Vertical Pod Autoscaler (VPA)

VPA is an add-on that automatically scales resource requests and limits for individual pods within a deployment. VPA monitors individual pod resource utilization and automatically increases or decreases container CPU and memory resource configuration to align cluster resource allotment with actual usage.

The VPA differs from the HPA in that the VPA adjusts the resource requirements for a pod while the HPA adjusts the number of pods.

The article Using the Vertical Pod Autoscaler to Automate Pod Rightsizing explains more in-depth how VPA works.

Here is a sample YAML file for a VPA that sets the minimum pod request under minAllowed to 100m for CPU and 256Mi for memory and defines the maximum it can grow to under maxAllowed.

apiVersion: autoscaling.k8s.io/v1
kind: VerticalPodAutoscaler
metadata:
  name: vpa-example
  namespace: default
spec:
  targetRef:
    apiVersion: apps/v1
    kind: Deployment
    name: my-deployment
  updatePolicy:
    updateMode: Auto
  resourcePolicy:
    containerPolicies:
    - containerName: my-container
      minAllowed:
        cpu: 100m
        memory: 256Mi
      maxAllowed:
        cpu: 2
        memory: 4Gi
      controlledResources: ["cpu", "memory"]

Using a VPA and monitoring your resource usage is a great way to understand better how your application uses resources.

Cluster Autoscaler

The Cluster Autoscaler adds nodes when pods fail to schedule and removes nodes when empty. It maintains an ideal cluster size that meets the application’s current needs. Additionally, other types of node autoscalers, such as Karpenter, offer advanced auto-scaling features, including faster scaling times, more granular control over instance types, and the ability to leverage spot instances for cost savings.

The on-demand scaling of nodes prevents resource bottlenecks during high-traffic periods and avoids wasting resources on underutilized nodes during low-traffic. However, note that the Cluster Autoscaler considers resource requests and limits rather than CPU/memory usage, which can result in overprovisioning resources. Proper right-sizing of all pods, potentially aided by tools like Kubecost, is a key practice to ensure efficient resource usage. When used together with the Cluster Autoscaler, this approach helps achieve optimal node scaling by ensuring resources are neither underutilized nor overprovisioned.

The yaml file below defines the Kubernetes Deployment for the Cluster Autoscaler. In the snippet below, the autoscaler will manage an autoscaling group named "MyNodePool" on AWS, starting with 1 node and scaling up to 10 nodes as needed. It considers various factors like CPU and memory usage to determine when to scale the cluster.

apiVersion: apps/v1
kind: Deployment
metadata:
  name: cluster-autoscaler
  namespace: kube-system
  labels:
    app: cluster-autoscaler
spec:
  replicas: 1
  selector:
    matchLabels:
      app: cluster-autoscaler
  template:
    metadata:
      labels:
        app: cluster-autoscaler
    spec:
      serviceAccountName: cluster-autoscaler
      containers:
      - image: k8s.gcr.io/autoscaling/cluster-autoscaler:v1.20.0
        name: cluster-autoscaler
        resources:
          limits:
            cpu: 100m
            memory: 300Mi
          requests:
            cpu: 100m
            memory: 300Mi
        command:
          - ./cluster-autoscaler
          - --v=4
          - --stderrthreshold=info
          - --cloud-provider=aws
          - --skip-nodes-with-local-storage=false
          - --expander=least-waste
          - --nodes=1:10:MyNodePool
        env:
          - name: AWS_REGION
            value: "us-west-2"
        volumeMounts:
          - name: ssl-certs
            mountPath: /etc/ssl/certs/ca-certificates.crt
            readOnly: true
      volumes:
      - name: ssl-certs
        hostPath:
          path: /etc/ssl/certs/ca-certificates.crt

Kubernetes Autoscaling and Best Practices for Implementations explains the workings of auto scalers in detail, along with diagrams.

Ensure pod health and availability

Maintaining healthy pods ensures that applications run smoothly and are available.

Healthy pods run within the set resource requirements and pass health checks, while unhealthy pods might have stability issues caused by a lack of resources.

Using pod disruption budgets (PDBs), readiness probes, and liveness probes can help maintain healthy pods.

Pod disruption budgets (PDBs)

A PDB defines the minimum number of pods an application needs to function smoothly during disruptions. PDB restrictions prevent pods from being terminated during voluntary scale-down or node drain events. This contributes to resource optimization and application uptime by ensuring that an application remains available and is not starved for resources by a node being drained.

apiVersion: policy/v1
kind: PodDisruptionBudget
metadata:
 name: zk-pdb
spec:
 minAvailable: 2
 selector:
   matchLabels:
     app: zookeeper


When node maintenance is required, schedule drain windows where PDB restrictions are relaxed and pod deletion is allowed.

K8s clusters handling 10B daily API calls use Kubecost

Readiness and liveness probes

A pod can take some time to spin up and be ready to take traffic. A readiness probe checks if a pod is ready to receive traffic. If not, the probe excludes it from receiving traffic until it becomes available. This prevents the pod cluster from wasting time and resources on a pod that is not ready yet.

Once a pod is ready, a liveness probe continuously monitors and identifies if the pod becomes unhealthy. If a pod is unhealthy, the probe restarts it and ensures availability.

Here is an example showing both a readiness and a liveness probe. In this example, the liveness probe will wait 15 seconds before checking if the pod responds on port 8080 and then checks every 10 seconds to make sure the application is still responding on port 8080.

apiVersion: v1
kind: Pod
metadata:
 name: goproxy
 labels:
   app: goproxy
spec:
 containers:
 - name: goproxy
   image: registry.k8s.io/goproxy:0.1
   ports:
   - containerPort: 8080
   readinessProbe:
     tcpSocket:
       port: 8080
     initialDelaySeconds: 15
     periodSeconds: 10
   livenessProbe:
     tcpSocket:
       port: 8080
     initialDelaySeconds: 15
     periodSeconds: 10

Overall ensure that your application runs smoothly so resources are not wasted on restarting or resources starved pods. Keeping your pods healthy will help keep your cluster usage stable.

Enforce resource constraints for namespaces

We can set two resource controls at the namespace level: the ResoureQuota and the LimitRange objects. You want resource controls at the namespace level to ensure that no individual namespace over-consumes resources.

For example, you could constrain a namespace to an aggregate total of 4 CPU cores, and 4 GB of Memory and limit it to have five service objects. At the same time, you could also set the default requests for 1 CPU and 1GB for each container.

Together, you can tightly control how your resources are utilized. Let’s take a look at an example of each.

ResourceQuota

With a ResourceQuota, you can define aggregate namespace limits on resources such as CPU and memory, as well as limits on objects such as pods or services.

One nice benefit of setting resource quotas is that whichever resource (CPU, memory) you set requests or limits for, each pod must have a setting for those resources.

For example, if you set requests.cpu to “2”, then each container must have a request for CPU set to ensure the total request for CPU does not exceed two

Below is an example of a ResourceQuota object that sets requests and limits for both CPU and memory.

apiVersion: v1
kind: ResourceQuota
metadata:
name: compute-resources
namespace: myspace
spec:
 hard:
  requests.cpu: "1"
  requests.memory: 1Gi
  limits.cpu: "2"
  limits.memory: 2Gi

With this set, each incoming pod must have both requests and limits set for CPU and memory before it can be scheduled. An easy way to ensure that limits and requests are set is to enable a LimitRange, which defines default requests and limits for containers.

LimitRange

A limit range object sets the minimum and maximum requests and CPU and memory limits at the pod or container level.

This example sets default limits and requests for CPU and sets min/max values as well.

apiVersion: v1
kind: LimitRange
metadata:
  name: my-limit-range
spec:
  limits:
    - type: Pod
      Default: # default limits
        cpu: 500m
      defaultRequest: # default requests
        cpu: 500m
      max:
        cpu: "2"
        memory: "1Gi"
      min:
        cpu: "200m"
        memory: "100Mi"
    - type: Container
      max:
        cpu: "1"
        memory: "500Mi"
      min:
        cpu: "100m"
        memory: "50Mi"
      default:
        cpu: "300m"
        memory: "200Mi"
      defaultRequest:
        cpu: "200m"
        memory: "150Mi"
      maxLimitRequestRatio:
        cpu: "2"
        memory: "2"

Keep in mind that the best practice is to have your developers set proper requests and limits for their applications. Setting a limit range is an extra layer of resource management, and these settings should be communicated to your teams.

Optimize resource allocation

Here are some important aspects of resource allocation to consider.

Load testing

Load testing simulates real-world traffic on your application and gives a clearer picture of resource consumption in production. Rightsizing requests based on load-testing observations helps understand application requirements and function with optimal resource usage. JMeter, Locust, K6, and similar tools are popular for load testing in Kubernetes environments.

Profiling

Inefficient application code leads to resource bottlenecks, such as high CPU utilization, memory leaks, and slow execution times, which impact application performance and result in resource exhaustion. Profiling tools such as Jaeger or Zipkin analyze application code when running and can provide insights on resource usage. They can also help identify specific code sections responsible for high resource consumption and allow one to focus on optimization efforts.

Learn how to manage K8s costs via the Kubecost APIs

Node affinity, node anti-affinity, node selectors, and pod priority

These features help control where pods are placed during scheduling. Fine-tuning this helps to ensure pods are placed on the nodes they are best suited for.

For example, you run memory-intensive pods on nodes with more memory and disk-intensive pods on nodes with faster hard drives.

Node selectors allow pods to schedule only on those nodes containing matching labels. Scheduling pods with specific hardware requirements on designated nodes frees up resources on other nodes for the remaining pods.

spec:
 containers:
 - name: nginx
   image: nginx
   imagePullPolicy: IfNotPresent
 nodeSelector:
   disktype: ssd

Node affinity is more flexible than node selectors. It can prefer or require that a pod be scheduled on nodes with specific labels or taints. For example, setting requiredDuringSchedulingIgnoredDuringExecution notes that a pod requires specific labels during pod scheduling, but if that changes while the pod is running, do not try to reschedule it. It can also require that a pod be scheduled if labels or taits change by using requiredDuringSchedulingRequiredDuringExecution.


In contrast, node anti-affinity prevents pods from being placed on nodes with specific labels or taints.

In the example below, the pod should schedule the nginx pod to nodes that have the key:value “disktype: ssd” (node affinity) and and schedule pods for the nginx-slow on nodes that do not have “disktype: ssd” set (anti-affinity).

apiVersion: v1
kind: Pod
metadata:
 name: nginx
spec:
 affinity:
   nodeAffinity:
     requiredDuringSchedulingIgnoredDuringExecution:
       nodeSelectorTerms:
       - matchExpressions:
         - key: disktype
           operator: In
           values:
           - ssd            
 containers:
 - name: nginx
   image: nginx
   imagePullPolicy: IfNotPresent
–--
apiVersion: v1
kind: Pod
metadata:
 name: nginx-slow
spec:
 affinity:
   nodeAffinity:
     requiredDuringSchedulingIgnoredDuringExecution:
       nodeSelectorTerms:
       - matchExpressions:
         - key: disktype
           operator: NotIn
           values:
           - ssd            
 containers:
 - name: nginx
   image: nginx
   imagePullPolicy: IfNotPresent

The pod priority feature allows you to define a relative priority for pods within a namespace. Higher-priority pods get scheduled first when competing resource demands exist, while lower-priority pods can utilize leftover resources without impacting critical workloads, maximizing overall cluster efficiency.

This requires first creating a PriorityClass and then referencing it in a pod spec. Below we see a PriorityClass set to 1000000, indicating a higher priority. These can range from -2147483648 to 1000000000.

apiVersion: scheduling.k8s.io/v1
kind: PriorityClass
metadata:
  name: high-priority-nonpreempting
value: 1000000
preemptionPolicy: Never
globalDefault: false
description: "This priority class will not cause other pods to be preempted."

The following example shows how to reference a priority class in a pod spec.

apiVersion: v1
kind: Pod
metadata:
 name: nginx
 labels:
   prio: high
spec:
 containers:
 - name: nginx
   image: nginx
   imagePullPolicy: IfNotPresent
 priorityClassName: high-priority

Quality of service (QoS)

Quality of Service (QoS) classes in Kubernetes play a significant role in resource optimization by prioritizing how pods access resources (CPU, memory) on a node. They also play a role during pod eviction should resources run low.

Here’s how the three QoS classes contribute to efficient resource utilization:

  • Guaranteed (for critical tasks): Guaranteed pods have defined CPU and memory requests and limits set to the same value. Kubernetes reserves resources exclusively for these pods, preventing other pods from consuming them, and guarantees predictable performance for critical workloads even during peak cluster utilization. These pods are also the last to be affected by a shortage of resources.
  • Burstable (for controlled usage): These pods have lower resource requests than limits and can utilize additional resources beyond their requests on demand. However, Kubernetes throttles back the containers if they consistently exceed their limits, allowing them to burst for short periods without impacting guaranteed pods and preventing them from hogging resources indefinitely. These pods are evicted only after Best Effort pods have been evicted.
  • Best effort (for flexible tasks): These pods have no guaranteed resources, and the Kubernetes scheduler schedules them only when sufficient resources remain on the node after fulfilling requests and the limits of guaranteed and burstable pods. These are suitable for non-critical tasks that can tolerate fluctuations in performance or even temporary pauses during high resource utilization periods. These are the first pods to be evicted if the node is trying to conserve or reclaim resources.
Monitoring and optimization tools

Monitoring tools like Kubecost, Prometheus, and Grafana provide cost and utilization metrics. These tools can also track application health, response times, and cluster health.

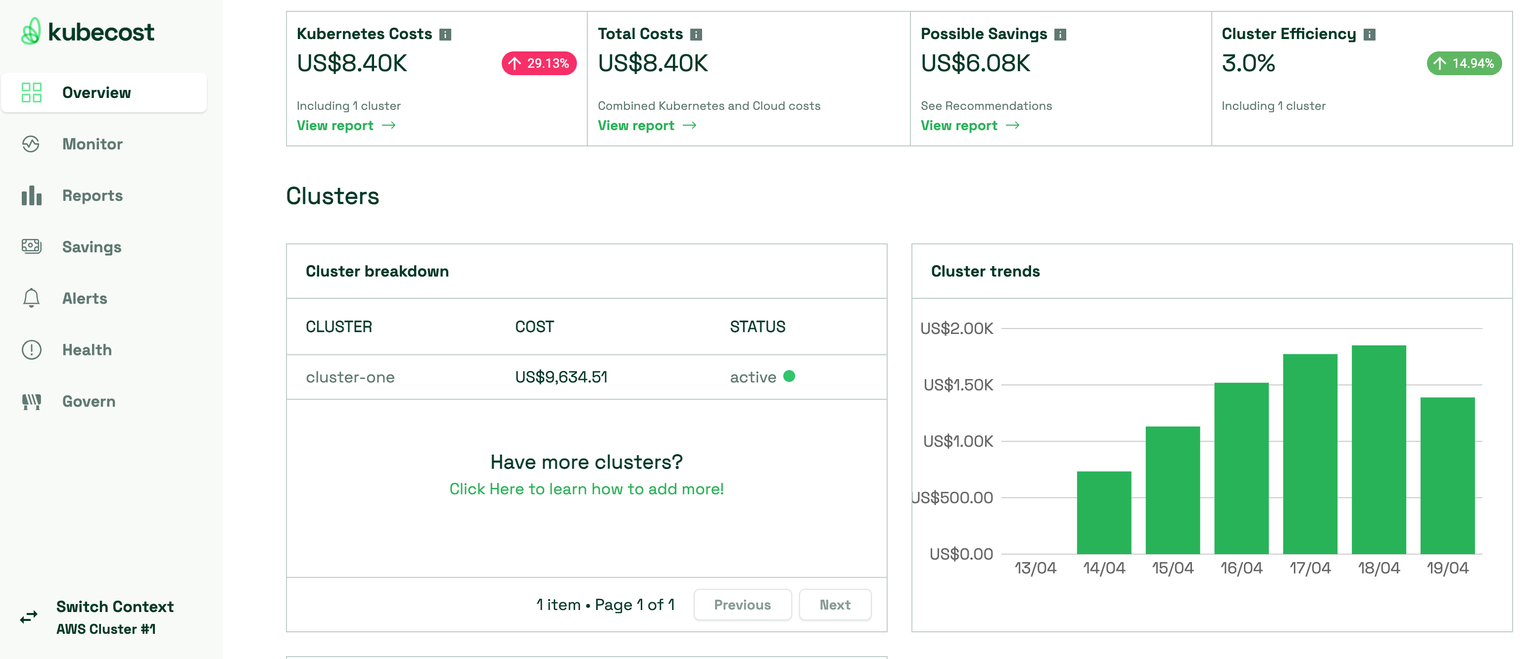
Kubecost highlights the pods, deployments, or namespaces consuming the most resources and provides recommendations for rightsizing. It also shows cost trends and a breakdown of pod-level granularity. The alerting system in Kubecost notifies key stakeholders when specified utilization levels, costs, or budget thresholds are reached, allowing you to take proactive measures before issues arise. The figure below shows the sample cost trends in Kubecost.

Kubecost dashboard highlighting cluster-level cost trends

Last thoughts

Kubernetes is an excellent platform for running containerized applications at scale. Maintaining the optimal balance between a cost-effective environment and stable performance is key to making the most out of it.

This article covered the top concepts for Kubernetes resource optimization. We started by understanding the foundations of resource allocation and how requests and limits for CPU and memory are the building blocks for good resource optimization. Then, we moved on to understanding the difference between over and under-provisioning nodes and the consequences this can have when resources are set to high or low.

To begin monitoring and understanding how your applications use resources, use auto-scalers to scale up (VPA) or scale out (HPA) your deployments or the cluster auto-scaler to scale out the number of nodes. This will help you understand the correct requests and limits for your application containers.

Once the pod requests and limits are dialed in, maintain good application health by implementing pod disruption budgets and readiness/liveness probes to ensure your application is running smoothly and using its resources correctly. You can dial even further by setting limits on a namespace through resource quotas and limit ranges.

Lastly, you can control where your pods are placed by implementing node selectors, affinity rules, and pod priority classes to ensure you run your application workloads on the best-suited node.

To explore resource optimization even further, integrate third-party cost reporting platforms like Kubecost to link resource optimization to cost savings.

Comprehensive Kubernetes cost monitoring & optimization

Continue reading this series