Learn how to monitor Kubernetes clusters and their applications with essential tools and best practices.

Kubernetes Monitoring: A Complete Guide

In the realm of cloud-native architecture, Kubernetes is the de facto standard for container orchestration. Its ability to scale, manage, and automate containerized applications has revolutionized how we deploy and control software.

However, while Kubernetes simplifies many aspects of container management, it also introduces new challenges, particularly regarding monitoring. Effective Kubernetes monitoring is crucial for maintaining the health, performance, and security of your containerized applications.

This article aims to comprehensively illustrate Kubernetes monitoring, its significance, and the essential aspects you should monitor. We explore the tools and best practices for monitoring Kubernetes clusters and their applications. By the end of this article, you’ll be equipped with the knowledge and tools needed to ensure that your cloud-native ecosystem operates seamlessly.
Summary of Kubernetes monitoring best practices

Best practice Description
Collect comprehensive metrics Ensure that you collect various metrics, including resource utilization, application-specific performance indicators, and network statistics. This holistic approach provides a complete view of your Kubernetes ecosystem.
Set up alerts and thresholds Set up proactive alerts with well-defined thresholds to notify you of potential issues before they become critical. Tailor alerts to match your applications’ specific needs and criticality.
Monitor pods and nodes Monitor the health and performance of individual pods and nodes. Monitor pod restarts, node failures, and resource bottlenecks to maintain application stability.
Perform security monitoring Implement security monitoring practices such as vulnerability scanning, anomaly detection, and access control auditing. Regularly review security configurations and policies to ensure compliance.
Establish resource quotas and limits Define and enforce resource quotas and limits for pods to prevent resource contention and ensure fair resource allocation. Regularly review and adjust quotas as application requirements evolve.
Conduct regular reviews and optimization efforts Frequently review monitoring data and alerts to identify areas for improvement. Optimize resource allocation, scaling, and application performance based on these insights.
Monitor costs Track the cost of running your Kubernetes workloads. Identify cost-saving opportunities by optimizing resource usage, right-sizing instances, and utilizing Kubernetes autoscaling features to reduce unnecessary expenses. Leveraging a tool like Kubecost can provide great benefits.

Setting up monitoring in Kubernetes

Monitoring is a crucial aspect of effectively managing Kubernetes clusters. By setting up comprehensive monitoring, you can gain insights into your cluster’s health, performance, and resource utilization, enabling you to address issues and optimize your infrastructure proactively. Several monitoring solutions are available for Kubernetes, including open-source tools like Prometheus, Grafana, and Alertmanager and commercial options like Datadog and New Relic.

Choose a solution that aligns with your requirements and budget. Setting up Prometheus and Grafana for monitoring your Kubernetes cluster is a common choice and can provide a robust monitoring solution. The following are detailed steps for setting up Prometheus, Grafana, and FluentD, three common monitoring components, assuming that a Kubernetes cluster is already up and running:

  • Prometheus: A monitoring tool built for aggregating metrics in containers that can be used for setting up alerts.
  • Grafana: A monitoring tool that can be used to visualize Prometheus data.
  • FluentD: A tool for aggregating a system’s logs into one source.

Prerequisites

This article assumes that the following tools and resources are available/installed:

  • A Kubernetes cluster with sufficient resources like CPU and memory
  • Kubectl
  • Helm
  • Bash or PowerShell
  • Admin rights on the cluster and local machine to install the required tools. If this is not already set up, there are additional steps that need to be done that are not covered in this article.

Install Prometheus

Follow these steps to set up Prometheus:

  1. Create a namespace: Create a Kubernetes namespace to isolate your monitoring components:
    kubectl create namespace monitoring
  2. Install Prometheus with Helm: Use Helm, a package manager for Kubernetes, to deploy Prometheus and its components. When you install Prometheus using the Helm chart, the Alertmanager component is automatically deployed alongside Prometheus as part of the overall installation. Before you begin, make sure you have Helm installed, then add the Prometheus Helm repository:
    helm repo add prometheus-community \
    https://prometheus-community.github.io/helm-charts
  3. Install Prometheus:
    helm install prometheus prometheus-community/prometheus --namespace monitoring
  4. Set up port forwarding (local access): To set up local access to the Prometheus UI, we will forward localhost port 9090 to port 80. Do this in another terminal window from the main one you are working on. Note that this forwarding is temporary and will close if you close the connection.
    kubectl port-forward -n monitoring \
    service/prometheus-server 9090:80 &
  5. Access the Prometheus UI: Open a web browser and visit http://localhost:9090 to access the Prometheus web interface. You can use this interface to query and visualize metrics.
  6. Configure Alertmanager: Create a file named alertmanager-config.yaml with the email notification configuration:
    global:
      resolve_timeout: 5m
    
    route:
      group_by: ['alertname', 'cluster', 'service']
      group_wait: 30s
      group_interval: 5m
      repeat_interval: 12h
      receiver: 'email-notifier'
    
    receivers:
    - name: 'email-notifier'
      email_configs:
      - to: 'your-email@example.com'
        from: 'alertmanager@example.com'
        smarthost: 'smtp.example.com:587'
        auth_username: 'your-username'
        auth_password: 'your-password'
        auth_secret: 'your-secret'
        auth_identity: 'your-identity'
    
  7. Edit the Prometheus Helm chart values: Alternatively, use the --set flag during installation to mount the custom configuration file at the specified path.
    helm install prometheus prometheus-community/prometheus --set alertmanager.configFiles[0].name=alertmanager-config.yaml--set alertmanager.configFiles[0].mountPath=/etc/alertmanager/config/alertmanager-config.yaml
  8. Delete the pod: Finally, delete the pod to restart the Alertmanager service.
    kubectl delete pod <alertmanager-pod-name> -n monitoring

Install Grafana

  1. Add the Grafana Helm repository:
    helm repo add grafana https://grafana.github.io/helm-charts
  2. Install Grafana:
    helm install grafana grafana/grafana --namespace monitoring
  3. Retrieve the admin password: To access the Grafana UI, you need the admin password. You can retrieve it by running the following command:
    kubectl get secret -n monitoring grafana -o jsonpath="{.data.admin-password}" | base64 --decode ; echo
  4. Set up port forwarding (local access): To access Grafana UI locally, port-forward the Grafana service:
    kubectl port-forward -n monitoring service/grafana 3000:80 &
  5. Access the Grafana UI: Open a web browser and visit http://localhost:3000. Log in with the username admin and the password retrieved in the previous step.
  6. Configure Prometheus as a data source in Grafana: To complete this section, both Prometheus and Grafana should be installed and available to use. Then follow these steps:
    • Log into the Grafana UI.
    • Click the gear (⚙️) icon on the left sidebar to access the configuration menu.
    • Click on Data Sources and then Add data source.
    • Choose Prometheus from the list of data sources.
    • In the settings, specify the Prometheus server’s URL (e.g., http://prometheus-server.monitoring) and click Save & Test to ensure that the connection is successful.
  7. Create dashboards in Grafana:
    • Click the plus (+) icon on the left sidebar to create a new dashboard.
    • Add a new panel to the dashboard, select the Prometheus data source, and use PromQL queries to create visualizations and graphs based on your metrics.
    • Customize your dashboard with various panels, text, and visualization options.
  8. Set up alerting:
    • In Grafana, you can configure alerting rules and notification channels. This is crucial for getting alerted about critical issues.
    • Create alert rules based on your specific requirements and integrate them with notification channels like email, Slack, or other options.

Comprehensive Kubernetes cost monitoring & optimization

Install FluentD

To deploy FluentD as a daemonset, use the following configuration file.

apiVersion: apps/v1
kind: DaemonSet
metadata:
  name: fluentd
  namespace: kube-system
spec:
  selector:
    matchLabels:
      name: fluentd
  template:
    metadata:
      labels:
        name: fluentd
    spec:
      tolerations:
      - key: node-role.kubernetes.io/master
        effect: NoSchedule
      containers:
      - name: fluentd
        image: fluent/fluentd-kubernetes-daemonset:v1.12.3-debian-kafka-2.6
        env:
        - name: FLUENTD_ARGS
          value: -c /fluentd/etc/fluent.conf
        volumeMounts:
        - name: config
          mountPath: /fluentd/etc
      volumes:
      - name: config
        configMap:
          name: fluentd-config

Then apply the Fluentd DaemonSet:

kubectl apply -f fluentd-daemonset.yaml

Collect comprehensive metrics

Comprehensive metrics collection in Kubernetes is vital for gaining insights into cluster health, resource utilization, and application performance. Key considerations include:

  • Setting up data sources (Prometheus, Node Exporter)
  • Defining alerting rules (Alertmanager)
  • Visualizing metrics through dashboards (Grafana)
  • Scaling the monitoring solution to accommodate cluster growth

Regular review and adjustment are essential to adapt to evolving needs and ensure the stability and efficiency of the Kubernetes environment.

Deploy Node Exporter for resource utilization metrics

To gather metrics from a node, they must be exposed so that they can be consumed by Prometheus. The Node Exporter exposes node-level resource utilization metrics like the following:

  • CPU metrics: node_cpu_seconds_total
  • Memory metrics: node_memory_MemAvailable_bytes, node_memory_SwapUsage_bytes
  • File system metrics: node_filesystem_avail_bytes, node_filesystem_size_bytes
  • Network metrics: node_network_receive_bytes_total, node_network_transmit_bytes_total
  • Disk I/O metrics: node_disk_read_bytes_total, node_disk_written_bytes_total
  • Uptime metrics: node_time_seconds, node_boot_time_seconds

This list is not exhaustive; more details on what can be done with Node Exporter can be found here.

Follow these steps:

  1. Create a node-exporter.yaml manifest:
    apiVersion: apps/v1
    kind: DaemonSet
    metadata:
      name: node-exporter
      namespace: monitoring
    spec:
      selector:
        matchLabels:
          name: node-exporter
      template:
        metadata:
          labels:
            name: node-exporter
        spec:
          hostNetwork: true
          containers:
            - name: node-exporter
              image: quay.io/prometheus/node-exporter
              ports:
                - containerPort: 9100
    
  2. Apply the DaemonSet:
    kubectl apply -f node-exporter.yaml
  3. Verify that the node-exporter daemonset is deployed:
    kubectl get daemonset node-exporter -n monitoring -o wide
    
    NAME            DESIRED   CURRENT   READY   UP-TO-DATE   AVAILABLE   NODE SELECTOR   AGE     CONTAINERS      IMAGES                             SELECTOR
    node-exporter   1         1         0       1            0           <none>          2m13s   node-exporter   quay.io/prometheus/node-exporter   name=node-exporter

Deploy kube-state-metrics for cluster health metrics

kube-state-metrics collects metrics about your Kubernetes objects’ state. Use a Helm chart to deploy kube-state-metrics:

helm repo add prometheus-community \
https://prometheus-community.github.io/helm-charts
helm install kube-state-metrics prometheus-community/kube-state-metrics --namespace monitoring

Configure Prometheus for resource utilization and cluster health metrics

Create a prometheus-config.yaml file to configure Prometheus:

apiVersion: v1
kind: ConfigMap
metadata:
  name: prometheus-server-conf
  labels:
    prometheus: server
data:
  prometheus.yml: |-
    global:
      scrape_interval: 15s
    scrape_configs:
      - job_name: 'kubernetes-apiservers'
        kubernetes_sd_configs:
        - role: endpoints
        scheme: https
      - job_name: 'kubernetes-nodes'
        kubernetes_sd_configs:
        - role: node
      - job_name: 'kubernetes-pods'
        kubernetes_sd_configs:
        - role: pod
      - job_name: 'kube-state-metrics'
        kubernetes_sd_configs:
        - role: endpoints
        relabel_configs:
        - source_labels: [__meta_kubernetes_namespace]
          action: keep
          regex: monitoring
K8s clusters handling 10B daily API calls use Kubecost

Apply the configuration:

kubectl apply -f prometheus-config.yaml -n monitoring

Configure service monitors for application performance metrics

If your application exposes metrics on a specific port, a service monitor can be created to scrape those specific metrics. Shown below is an example YAML file of a service monitor to query the web port (80) for pods labeled with “example-app.”

apiVersion: monitoring.coreos.com/v1
kind: ServiceMonitor
metadata:
  name: example-app
  namespace: monitoring
spec:
  endpoints:
    - port: web
  selector:
    matchLabels:
      app: example-app

Set up alerts and thresholds

Kubernetes alerting with Prometheus is critical to ensuring your cloud-native applications’ reliability. Alerting rules in Prometheus allow you to specify conditions and thresholds that, when met, trigger notifications, helping you proactively address issues.

It is important to note that you need an Alertmanager setup that efficiently manages and responds to alerts. Fully configuring Alertmanager is outside the scope of this article, but the following are some examples of configurable alerts.

High CPU usage alert

  1. Create a YAML file named high-cpu-alert-rules.yaml to define the PrometheusRule custom resource:
    apiVersion: monitoring.coreos.com/v1
    kind: PrometheusRule
    metadata:
      name: high-cpu-alert-rules
    spec:
      groups:
        - name: high-cpu-alert-rules
          rules:
            - alert: HighCpuUsageAlert
              expr: |
                100 - (avg(irate(node_cpu_seconds_total{mode="idle"}[5m])) * 100) > 90
              for: 1m
              labels:
                severity: critical
              annotations:
                summary: "High CPU Usage Detected"
                description: "The average CPU usage is above the threshold for 1 minute."
    
    This YAML file defines a PrometheusRule with an alerting rule named HighCpuUsageAlert. The rule triggers an alert when the CPU usage exceeds 90% for 1 minute.
  2. Apply the YAML file to your Kubernetes cluster to create the PrometheusRule:
    kubectl apply -f high-cpu-alert-rules.yaml
  3. Check that the PrometheusRule has been created successfully:
    kubectl get PrometheusRule high-cpu-alert-rules -n monitoring

High memory usage alert

  1. Create a YAML file named high-memory-alert-rules.yaml to define the PrometheusRule custom resource:
    apiVersion: monitoring.coreos.com/v1
    kind: PrometheusRule
    metadata:
      name: high-memory-alert-rules
    spec:
      groups:
        - name: high-memory-alert-rules
          rules:
            - alert: HighMemoryUsageAlert
              expr: |
                (1 - (node_memory_MemFree_bytes / node_memory_MemTotal_bytes)) * 100 > 90
              for: 1m
              labels:
                severity: critical
              annotations:
                summary: "High Memory Usage Detected"
                description: "The available memory is below 10% for 1 minute."
    
    This YAML file defines a PrometheusRule with an alerting rule named HighMemoryUsageAlert. The rule triggers an alert when the available memory falls below 10% for 1 minute.
  2. Apply the YAML file to your Kubernetes cluster to create the PrometheusRule:
    kubectl apply -f high-memory-alert-rules.yaml
  3. Check that the PrometheusRule has been created successfully:
    kubectl get PrometheusRule high-memory-alert-rules -n monitoring

Monitor pods and nodes

Monitoring pods and nodes in a Kubernetes environment with Prometheus is essential for ensuring optimal performance and resource utilization. Monitoring individual pods is also crucial to understanding the health and performance of your applications.

Pod monitoring

With Prometheus, you can define rules to track metrics such as CPU and memory usage, network traffic, and application-specific data. For instance, you can set up a pod monitoring service monitor to scrape metrics from a specific application pod:

apiVersion: monitoring.coreos.com/v1
kind: ServiceMonitor
metadata:
  name: example-app-monitor
  namespace: monitoring
spec:
  selector:
    matchLabels:
      app: example-app
  endpoints:
    - port: metrics

This ServiceMonitor configuration selects pods labeled with “app: example-app” and scrapes metrics from the “metrics” port, assuming your application exposes metrics on that port.

Node monitoring

Monitoring the cluster nodes provides insight into your Kubernetes cluster’s overall health and resource utilization. With Prometheus and Node Exporter, you can collect essential node-level metrics, including CPU, memory, disk, and network usage. Details of how to set up Node Exporter were provided earlier in this article.

Perform security monitoring

Security monitoring is critical to managing Kubernetes clusters. Routine security monitoring helps detect and respond to potential threats and vulnerabilities.

This section is a high-level overview of the topics you may want to consider monitoring.

Cluster auditing

Auditing in Kubernetes involves monitoring and recording activities within the cluster to maintain security and compliance. Prometheus can be utilized to scrape and store metrics related to auditing events. Audit logs keep a record of system happenings, such as login activity, system changes, and data access.

Start by enabling audit logging on your Kubernetes cluster. Edit the kube-apiserver manifest file (usually located at /etc/kubernetes/manifests/kube-apiserver.yaml) to include the audit-log flags:

  • audit-log-path=/var/log/kubernetes/audit.log
  • audit-log-format=json

In the example below, only two lines are added to the existing kube-apiserver YAMIL file (they are highlighted in yellow). These two lines specify the path and format for audit logs.

apiVersion: v1
kind: Pod
metadata:
  name: kube-apiserver
  namespace: kube-system
spec:
  containers:
  - command:
    - kube-apiserver
    - ...
    - --audit-log-path=/var/log/kubernetes/audit.log
    - --audit-log-format=json
    ...
Learn how to manage K8s costs via the Kubecost APIs

Now follow these steps:

  1. Set up Fluentd to collect audit logs: This Fluentd configuration reads the Kubernetes audit logs and exposes them in a format that Prometheus can scrape.
    apiVersion: v1
    kind: ConfigMap
    metadata:
      name: fluentd-config
      namespace: kube-system
    data:
      fluent.conf: |
        <source>
          @type tail
          @id input_tail
          path /var/log/kubernetes/audit.log
          pos_file /var/log/td-agent/audit.log.pos
          tag kube.audit.log
          read_from_head true
          <parse>
            @type json
          </parse>
        </source>
    
        <match kube.audit.log>
          @type prometheus
          <labels>
            k8s_audit_type ${record['auditAnnotations']['k8s_audit_type']}
            k8s_resource ${record['auditAnnotations']['k8s_resource']}
          </labels>
        </match>
    
  2. Apply the config:
    kubectl apply -f fluentd-config.yaml
  3. Set Up Prometheus to scrape Fluentd Metrics: Modify your Prometheus configuration (prometheus-config.yaml) to include Fluentd metrics:
    - job_name: 'fluentd'
      static_configs:
      - targets: ['fluentd.kube-system:24231']
    
  4. Apply the Prometheus configuration:
    kubectl apply -f fluentd-config.yaml

If the Fluentd metrics are being scraped by Prometheus, queries like kube_audit_type or kube_resource should show the scraped audit logs.

Container scanning

Container scanning is a security practice that assesses container images for known vulnerabilities and compliance issues before deployment, reducing the risk of exploitation and enhancing overall system security. It’s essential to ensure that only secure and compliant container images are deployed, safeguarding against potential exploits and data breaches.

Leverage container scanning tools like Clair or Trivy to analyze container images for known vulnerabilities before deployment.

Compliance scanning

Regularly scan your cluster against compliance benchmarks like CIS Kubernetes Benchmark using a tool like kube-bench. This will ensure that your cluster adheres to security best practices.

Establish resource quotas and limits

As a Kubernetes administrator, keeping a close eye on resource quotas and limits within your cluster is crucial for optimizing resource utilization, preventing resource contention, and maintaining application performance and stability. Prometheus is a valuable tool for monitoring and alerting based on resource utilization metrics.

Resource quotas in Kubernetes set limits on resource consumption for namespaces, helping control resource allocation. On the other hand, resource limits at the container level define the maximum amount of CPU and memory a container can use. Using Prometheus, you can create alerting rules that trigger notifications when resource quotas or container resource limits are nearing exhaustion.

ResourceQuotas in Kubernetes don't inherently generate metrics that can be exposed directly via metric endpoints. However, you can indirectly monitor and enforce resource usage by collecting metrics related to the resource consumption of pods and containers in your Kubernetes cluster. Metrics such as CPU usage, memory usage, and other relevant statistics are typically exposed by components like kubelet and cAdvisor.

To collect and expose these metrics, you would configure Prometheus to scrape the relevant targets, such as Kubernetes nodes, pods, or containers.

  1. Enable ResourceQuota Monitoring in Kubernetes: Make sure that resource quota monitoring is enabled in your Kubernetes cluster. ResourceQuota metrics are exposed by the kube-apiserver, so ensure that the --runtime-config flag includes api/all=true in the kube-apiserver.yaml file.
  2. Configure Prometheus to Scrape ResourceQuota Metrics: Update your Prometheus configuration (prometheus-config.yaml) to include a new job for scraping kube-resourcequota metrics:
    - job_name: 'kubernetes-resourcequota'
      kubernetes_sd_configs:
      - role: endpoints
        namespaces:
          names:
          - 'default'
      relabel_configs:
      - source_labels: [__meta_kubernetes_service_label_component]
        action: keep
        regex: "kube-resourcequota"
    
    In Prometheus configuration, kubernetes_sd_configs is a section used to define Kubernetes service discovery configurations. This feature allows Prometheus to dynamically discover and monitor targets in a Kubernetes cluster. The kubernetes_sd_configs section specifies how Prometheus should discover and collect information about Kubernetes services, nodes, and pods. Prometheus allows you to define relabeling configurations to alter the labels of scraped metrics before they are stored. This feature is useful for adjusting metric labels to match your specific requirements or to filter and organize metrics based on certain criteria.
  3. Apply the updated Prometheus configuration:
    kubectl apply -f prometheus-config.yaml
  4. Define alerting rules: Prometheus alerting rules enable users to define conditions for generating alerts based on the metrics collected by Prometheus monitoring system. These rules specify the criteria for triggering alerts when certain conditions are met, helping operators detect and respond to potential issues in their systems. For detailed information and examples, refer to the official Prometheus documentation on alerting rules.
    Create a new file named alerting-rules.yaml to define alerting rules for ResourceQuotaExceeded:
    groups:
    - name: k8s-prometheus-alerts
      rules:
      - alert: ResourceQuotaExceeded
        expr: kube_resourcequota{resource="limits.cpu"} > kube_resourcequota{resource="limits.cpu.max"}
        for: 5m
        labels:
          severity: critical
        annotations:
          summary: "ResourceQuotaExceeded: CPU"
          description: "ResourceQuotaExceeded for CPU limits in the 'default' namespace."
    
    This rule triggers an alert when the CPU resource quota is exceeded in the default namespace.
  5. Apply the alerting rule:
    kubectl apply -f alerting-rules.yaml
  6. Verify the alerts:
    • Open the Prometheus web UI.
    • Execute a query like kube_resourcequota{resource="limits.cpu"} > kube_resourcequota{resource="limits.cpu.max"} to verify that the metric is being scraped.
    • Simulate a ResourceQuotaExceeded scenario by intentionally exceeding the CPU limits in a pod.
    • Observe the Prometheus Alerts tab or Grafana dashboard (if configured) for the triggered alert.

Conduct regular reviews and optimization efforts

Regular reviews and optimizations of your monitoring setup ensure that your Kubernetes environment remains efficient, cost-effective, and capable of providing meaningful insights for maintaining system health, performance, and security. It’s a proactive approach to adapting to the evolving nature of cloud-native systems and avoiding potential issues before they become critical.

Here are some important review and optimization considerations:

  • Evolving environments: Kubernetes clusters and the applications they host are dynamic. They continuously change due to updates, scaling, and new deployments. Regular reviews ensure that your monitoring system remains aligned with your evolving environment.
  • Resource efficiency: Monitoring systems themselves consume resources. Over time, inefficient setups can lead to resource contention or performance issues. Optimization can reduce resource usage and costs.
  • Alert fatigue: Poorly configured or outdated alerting rules can lead to alert fatigue, where teams become overwhelmed with non-actionable alerts. Regular optimization helps fine-tune alerts to focus on critical issues.
  • Data retention: Monitoring systems collect vast amounts of data. Reviewing and optimizing data retention policies can help manage storage costs and ensure that you retain data for compliance or analysis. Adjust data retention policies based on compliance requirements and data analysis needs. Delete old or irrelevant data to manage storage costs.
  • Performance tuning: Monitoring components like Prometheus may require performance tuning as the volume of data and the complexity of queries increases. Optimization ensures that your system performs efficiently. Regularly fine-tune configurations as required, including adjusting resource allocations for monitoring components or optimizing query performance.
  • Review alerting rules: Regularly review and update alerting rules. Remove obsolete alerts, fine-tune thresholds, and ensure that alerts are actionable and provide relevant information.
  • Resource allocation: Ensure that your monitoring components have adequate resources. Monitor CPU, memory, and storage utilization and scale resources as necessary.
  • Automated anomaly detection: Implement automated anomaly detection systems that can identify and alert unusual patterns and behaviors, reducing the reliance on static alerting rules.
  • Scaling strategies: Review your scaling strategies for monitoring components. Ensure that they can handle increased workloads as your Kubernetes environment grows.

Monitor costs

Cost monitoring in Kubernetes is crucial for managing cloud-native infrastructure efficiently and ensuring that you’re not overspending on cloud resources in the following ways:

  • Resource efficiency: Kubernetes clusters can be resource-intensive, and it’s easy to overprovision or misconfigure resources, leading to unnecessary costs. Cost monitoring helps you identify underutilized or overallocated resources.
  • Budget control: Costs can quickly escalate in the cloud-native ecosystem, especially in a multi-tenant or dynamic environment. Cost monitoring provides visibility into your spending, helping you stay within budget.
  • Optimization: Monitoring costs can reveal opportunities for optimization, such as right-sizing resources, using spot instances, or employing cost-effective storage solutions.
  • Chargeback and showback: If you operate a multi-team or multi-project environment, cost monitoring allows you to allocate expenses back to specific teams or projects, encouraging accountability.

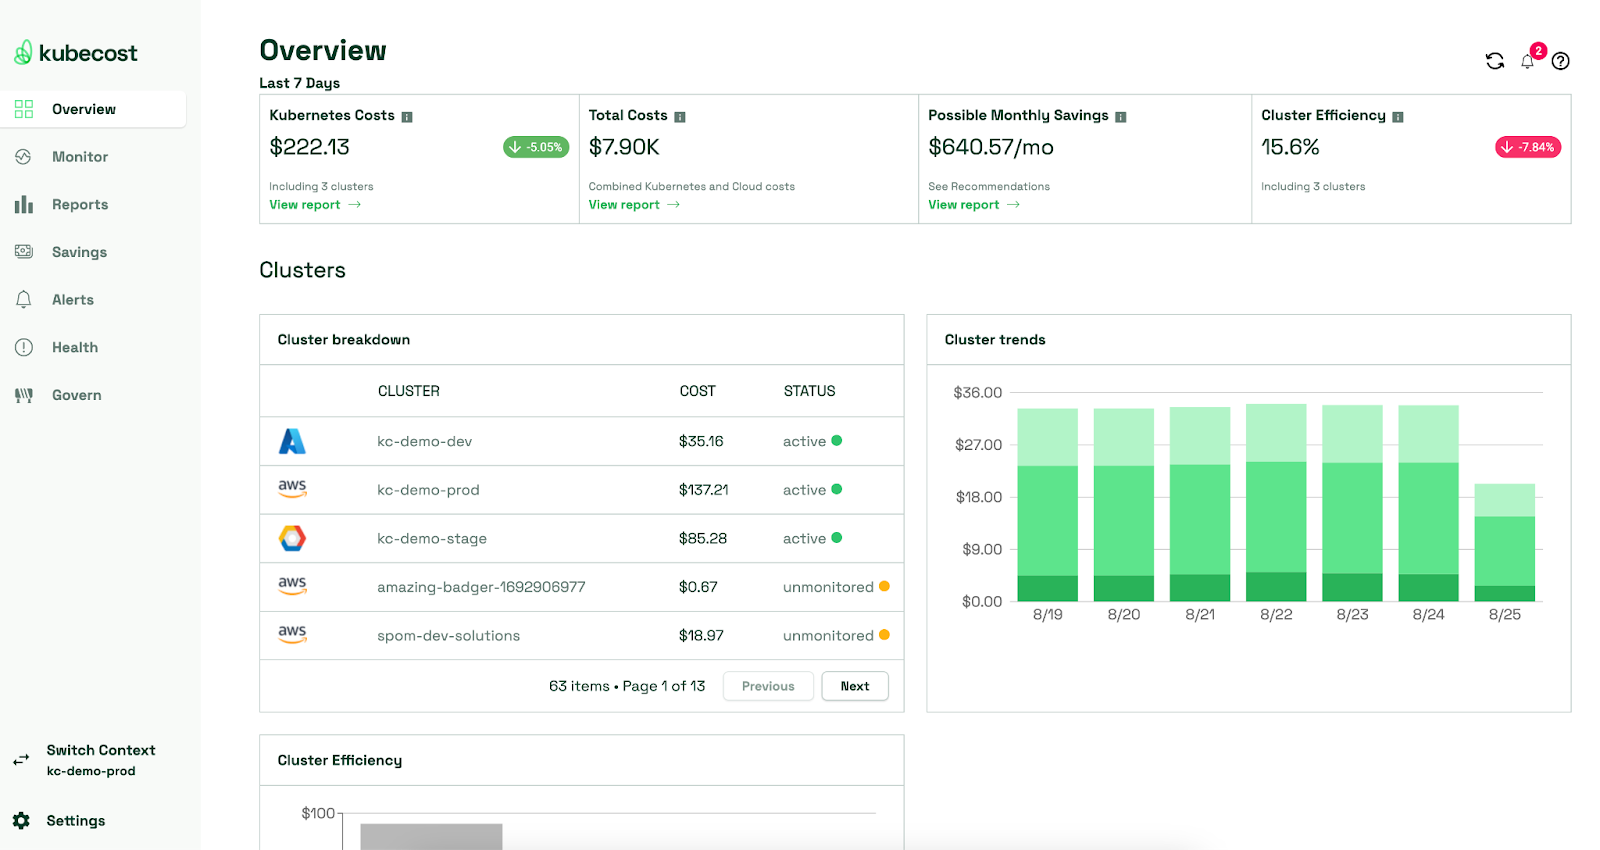
Kubecost is a specialized cost-monitoring tool designed for Kubernetes environments. It offers the following advantages:

  • Granular visibility: Kubecost provides detailed insights into your Kubernetes cost breakdown, showing expenses per namespace, service, deployment, and more to help you identify cost drivers.
  • Resource optimization: With Kubecost, you can analyze cost trends over time, discover underutilized resources, and optimize your Kubernetes cluster for cost efficiency.
  • Alerting: Kubecost offers cost-based alerting, allowing you to set up alerts when spending exceeds defined thresholds, thus enabling timely cost-control actions.
  • Showback and chargeback: Kubecost supports showback and chargeback mechanisms, facilitating transparent cost allocation and accountability in multi-team or multi-project environments.
  • Scenario planning: Kubecost enables you to perform “what-if” scenarios to assess changes in your cluster configuration, like resizing nodes or switching to reserved instances.

An image showing the GUI of kubecost and its detailed visualization (source)

Conclusion

Monitoring Kubernetes is not just a best practice: It’s a fundamental necessity for ensuring the stability, security, and performance of your cloud-native applications and infrastructure. The dynamic and scalable nature of Kubernetes makes effective monitoring essential for identifying and addressing issues before they impact your users and business operations.

By leveraging industry-accepted tools like Prometheus, implementing comprehensive metrics collection, integrating log management, implementing cost optimization tools, and embracing best practices, organizations can gain insights into their Kubernetes environments, proactively respond to challenges, and optimize resource utilization. Kubernetes monitoring is a continuous commitment to maintaining the reliability and success of modern containerized applications.

Comprehensive Kubernetes cost monitoring & optimization

Continue reading this series