Learn how to implement effective monitoring for Elastic Kubernetes Service (EKS), including understanding what components to monitor, selecting the right tools, and best practices for a production-ready environment.

EKS Monitoring: The What and How for EKS Clusters

AWS Elastic Kubernetes Service (EKS) is one of the most popular managed Kubernetes services today. With so many modern applications depending on EKS for container orchestration, EKS health and performance are major business concerns.

Implementing effective EKS monitoring gives administrators insights into their cluster’s performance, helps track costs, and alerts them of critical events. Getting EKS monitoring right can be challenging as it requires the right mix of strategy, tooling, and tactics.

This article will teach readers how to develop a high-quality monitoring setup by understanding what they should monitor, how to select the right tools, and how to apply best practices for a production-ready environment.

Summary of key EKS monitoring concepts

The table below summarizes the five EKS monitoring concepts this article will explore in detail.

Concept Description
The five key elements of EKS monitoring Five key aspects of monitoring must be understood to evaluate tooling options properly.
Monitoring cluster components The areas of an EKS cluster to monitor include the control plane, worker nodes, pods, addons, and AWS resources like EBS volumes.
How to gather EKS monitoring requirements There are many tools available for many use cases. Administrators must carefully evaluate their use case requirements to select a monitoring approach correctly.
8 popular EKS monitoring tools EKS supports many monitoring tools, including AWS services, open-source projects, and 3rd party managed platforms. Understanding the strengths and weaknesses of each approach is necessary for selecting an appropriate option.
Monitoring Security Best Practices Five basic security best practices should be followed regardless of the selected tools, including restricting access to sensitive log data.

The five key elements of EKS monitoring

There are five essential elements of a monitoring setup. Understanding all five will help teams make informed decisions about their EKS monitoring and drive improvements in infrastructure observability. The sections below explain each element in detail.

Metrics

A metric is a quantifiable data point providing insight into specific indicators, like CPU utilization for a compute instance. Many EKS cluster components generate metrics and are a crucial resource for monitoring the health and performance of an EKS cluster and workloads. Monitoring tools can "scrape" these metrics from target components and record them for long-term storage, allowing administrators to track trends and patterns over time and modify their cluster's configuration based on this insight.

For example, tracking CPU utilization metrics for each day of the week may enable observations useful for scaling according to predicted usage demands throughout the week. EKS clusters generate hundreds of different metrics from various components (discussed below), and obtaining this data allows administrators to make intelligent decisions for their clusters.

While Prometheus is a standalone monitoring project, Prometheus metrics are the standard for Kubernetes use cases. All Kubernetes components (like the Kubelet and Kube Scheduler) and practically all projects in the Kubernetes ecosystem (like Kubecost) will generate metrics in this format. This is useful for administrators since standardization ensures any Kubernetes project will be compatible with Kubernetes-native monitoring tools.

The Prometheus metric format defines the metric’s name and specifies label keys and values to make the data easier to query along different dimensions.

<metric name>{<label name>=<label value>, ...}


For example, below, we may want to query the number of HTTP requests based on the HTTP Method (POST, GET, PUT, etc). Therefore, we specify the metric’s name and the HTTP Method type as a label. Now we can run queries to answer questions like “How many HTTP requests were there in the last 1 hour where the HTTP Method was POST?”

api_http_requests_total{method="POST", handler="/messages"}

Logs

Kubernetes logs are text-based data generated by Kubernetes components in real-time for troubleshooting and analysis. Every Kubernetes cluster component produces log files, which can be collected and stored by a monitoring tool. Administrators can then query these logs to gain insight into their cluster. Logs differ from metrics by containing more flexible data than just quantifiable numbers.

For example, the Kube API Server produces audit logs containing details about requests to access the API Server. This is valuable for administrators who want to analyze which users are attempting to access their cluster's API Server, what objects they requested or created, and the HTTP response code. This information is more easily represented in log format than metric numbers, and therefore, administrators will benefit from ensuring their monitoring setup collects metrics and logs simultaneously. Both types of data are critical for monitoring the status of a cluster.

Here is an example of an audit log entry from AWS CloudWatch Log services:

time="2024-01-01T10:09:43Z" msg="access granted" arn="arn:aws:iam::12345678910:user/awscli" client="127.0.0.1:51234" groups="[system:masters]" method=POST path=/authenticate sts=sts.eu-west-1.amazonaws.com username=kubernetes-admin"

Traces

Tracing is another type of data available for collection and analysis in a monitoring system. A trace records the flow of requests in a distributed system (like Kubernetes microservices). As a request enters a distributed system and flows through various services, administrators can gather data from these services to build a picture of which services were hit by the request, processing time per service, average latency, error sources, etc. A trace aggregates all the data from each service about a particular request and can provide administrators with deep insight into traffic flow within their clusters.

Kubernetes components like the API Server do not generate trace data; this type of data is typically generated by:

  • Application developers who integrate libraries like OpenTelemetry to build tracing capabilities directly into their applications. Tracing libraries enable applications to expose trace data that other monitoring tools can scrape. Implementing this approach provides high visibility into the application's operations. However, it requires involvement from developer teams to modify application source code, which can be time-consuming, especially for complex microservice environments where many different applications are running.
  • Service mesh tools like Istio can also generate mesh data. Service meshes implement network proxies for every microservice, and each proxy can gather trace data for inbound/outbound requests to the service. This may allow a more straightforward approach to obtaining trace data. Still, data will be less detailed than when developers manually configure and customize trace data based on their application's design via a tracing library. Deploying and maintaining a service mesh is also a complex task, and needs to be carefully analyzed.

Comprehensive Kubernetes cost monitoring & optimization

Alerts

Alerting involves setting up notifications for anomalies in monitoring data. For example, administrators may want to be alerted if their cluster's utilization level is too high and close to resource exhaustion. For this example, administrators may set up alerts based on metrics like average CPU and memory utilization based on data provided by their cluster's compute instances (Worker Nodes). Alerting can also be a valuable security tool, such as providing alerts based on suspicious Audit log activity.

Alerting ties into the topic of monitoring because enabling an effective alerting setup requires consideration of how metrics and logs are collected and configured. Administrators will need to think about what kind of issues they want to be alerted about (for example, business-impacting problems like cluster resource exhaustion causing workloads to malfunction), how this data can be queried in the metric and log data (for example, average CPU, memory, and disk usage metrics), and what thresholds the alerting tool should implement to determine if an alert is necessary.

Visualizations

Visualizing monitoring data allows administrators to view and understand their metrics at a glance easily. For example, administrators may configure dashboards with customized panels to show only relevant metrics, enabling quick analysis of critical indicators without manually performing complicated data queries. Setting up practical visualization tools allows administrators to view their cluster's status quickly, which is essential during time-sensitive activities like troubleshooting or security incident investigations.

EKS monitoring for cluster components

There are many different components of an EKS cluster that can produce valuable logs and metrics. This section will help administrators understand what components of an EKS cluster require monitoring, what type of data they generate, and how teams can collect the data.

EKS cluster control plane

The control plane of a Kubernetes cluster includes many components responsible for operating the cluster. It is composed of Master Nodes and ETCD Nodes, which are compute instances hosting various binaries required for any standard Kubernetes cluster to function, such as the Kube Scheduler and Kube API Server. EKS is a managed service, so the control plane Nodes are hidden from the user and handled by EKS. However, metrics and logs are still exposed by the control plane binaries to assist administrators with understanding how their control plane is operating.

Administrators need to understand the components running in the EKS control plane and what data they can expose. This information is critical for troubleshooting issues such as performance bottlenecks and security auditing.

The five critical components of an EKS cluster control plane are: API server, Kube Controller Manager, Cloud Controller Manager, Kube Scheduler, and etcd. Let’s take a closer look at each one.

API server

This binary is the entry point for the cluster. It is responsible for responding to requests for cluster information (such as when you run Kubectl commands) or creating/updating objects. Kubernetes objects can only be modified by sending requests through the API Server.

The API Server exposes Prometheus metrics such as how many requests it receives, average processing time, and response codes. API Server metrics provide administrators with insight into how well the API Server is performing, whether the cluster's control plane is handling the current volume of requests, and whether any scaling issues are occurring for the control plane Nodes.

Alongside the Prometheus metrics, the API Server also exposes multiple log files providing additional insight into cluster operations:

  • API: These logs detail the flags passed as arguments to the API Server binary during startup. Administrators cannot modify these flags, but having insight into what flags are enabled will help to understand the cluster's configuration provided by EKS (such as which Admission Controllers are enabled by default).
  • Audit: These logs are critical for security analysis. They detail every request submitted to the API Server, what resources were viewed/created/modified, and what user performed the action. This log is essential for auditing access to the cluster and performing analysis, such as determining which user modified a particular resource.
  • Authenticator: While the above Audit log provides details about a Kubernetes user's requests, the Authenticator logs give details on which specific IAM Role or IAM User accessed the cluster. Since EKS implements IAM authentication for human users to access the cluster, correlating cluster actions with IAM entities is another aspect of security analysis.

Kube Controller Manager

This component is responsible for reconciling the desired state for the cluster for all standard objects like Pods, Nodes, Deployments, Services, etc. It continuously monitors the state of the cluster and reconciles resources to match the desired state specified in the Kubernetes object schema.

EKS exposes a log file (called controllerManager) for this control plane component, which contains details about the component's ongoing operations. This log file provides a lot of detail, which is quite helpful when investigating the sequences of events occurring in the cluster. For example, the log file below shows some log entries of a freshly created EKS cluster. EKS creates a CoreDNS deployment with two replicas by default. We can see Kube Controller Manager detecting the Deployment for CoreDNS, creating a corresponding ReplicaSet, and then launching new Pods. The log data from this component helps investigate any events occurring in the cluster involving resource reconciliation.

replica_set.go] "Too few replicas" replicaSet="kube-system/coredns-67f8f59c6c" need=2 creating=2
event.go] "Event occurred" object="kube-system/coredns" kind="Deployment" reason="ScalingReplicaSet" message="Scaled up replica set coredns-67f8f59c6c to 2"
event.go] "Event occurred" object="kube-system/coredns-67f8f59c6c" kind="ReplicaSet" reason="SuccessfulCreate" message="Created pod: coredns-67f8f59c6c-5fm42"

The Kube Controller Manager also exposes Prometheus metrics, such as the count of pending operations (workqueue_depth) and latency per operation (workqueue_queue_duration_seconds_bucket). Metrics for this binary are helpful in determining if a bottleneck is occurring in performing reconciliation. Abnormally high values or spikes could indicate the control plane is failing to scale, a user is applying excessive pressure on the control plane, or a workload (like an Operator) is misconfigured.

Cloud Controller Manager

Like the Kube Controller Manager, this component also reconciles Kubernetes objects. However, this particular binary focuses on cloud-specific resource reconciliation. When administrators create objects like a Service of type LoadBalancer and PersistentVolumes, they expect AWS Load Balancers and EBS volumes to be created.

The Cloud Controller Manager is responsible for creating these resources based on the schema of the provided Kubernetes objects. Note: most functionality of the Cloud Controller Manager is flagged for deprecation and will be delegated to other Controllers like the AWS Load Balancer Controller and the EBS CSI. Therefore, it may not be worthwhile for administrators to set up monitoring for this binary if their clusters are already running the replacement Controllers.

Kube Scheduler

The Kube Scheduler is responsible for binding incoming Pods to an available worker Node. It will compare the Pod's desired resource specifications (CPU and memory) and check which Nodes have available capacity. It will also apply logic related to affinity, nodeSelectors, and topologySpreadConstraints, which administrators can use to control Pod scheduling.

EKS provides the Scheduler logs and enables administrators to investigate the scheduling decisions being made for Pods. This can be useful when investigating why a particular Pod/Node binding decision was made, which may be necessary to troubleshoot issues related to affinity and Pod spread.

schedule_one.go] "Unable to schedule pod; no fit; waiting" pod="kube-system/coredns-67f8f59c6c-ldnmq" err="0/1 nodes are available: 1 node(s) had untolerated taint {node.kubernetes.io/not-ready: }. preemption: 0/1 nodes are available: 1 Preemption is not helpful for scheduling."

The Prometheus metrics exposed by the Scheduler include how many Pods are waiting for a scheduling decision (scheduler_pending_pods), how long scheduling decisions are taking (scheduler_pod_scheduling_duration_seconds), and how many low-priority Pods are being evicted to make space for higher priority Pods (scheduler_preemption_victims). These metrics can help troubleshoot issues related to pod scheduling delays or identify excessive pod terminations by looking at the eviction metrics. Data from the Scheduler will be useful for determining if the control plane can keep up with the number of Pods being created in the cluster.

etcd

The control plane hosts a database called etcd, which stores the entire state of the EKS cluster. The API Server is exclusively responsible for accessing and modifying items in this database. The etcd binary does not expose any log files for EKS administrators; however, it does expose some Prometheus metrics like the total requests for each object type, the number of errors, and total storage utilization.

There can be control plane issues related to etcd storage exhaustion, which the metrics will help validate. Since this component is critical for a properly functioning cluster, collecting metrics helps ensure control plane issues can be investigated quickly. Note: since administrators can't access the control plane, certain problems may require escalation to AWS Support. Providing metric data to the AWS support engineers will enable them to assist with troubleshooting more effectively.

Enabling control plane monitoring

Administrators can enable EKS control plane logging via the web console and AWS CLI. This will update the EKS cluster to generate CloudWatch Logs containing the information mentioned above. EKS can’t modify the log output target, so CloudWatch is the only option unless the administrator configures other tools to forward CloudWatch Logs to other log ingestion tools.

The metrics for control plane components are exposed at the Kubernetes /metrics endpoint. Any monitoring tool that scrapes Kubernetes metrics will also collect control plane metrics.
K8s clusters handling 10B daily API calls use Kubecost

Worker Nodes and Pods

Worker Nodes are compute instances that host the containerized applications deployed to an EKS cluster. Worker Nodes for EKS are most commonly EC2 instances but can also be serverless Fargate Nodes. Monitoring Nodes is essential for ensuring that instances are operating correctly in the EKS cluster.

Worker Nodes run a Kubernetes component called a Kubelet. This binary is responsible for deploying Pods on the local host based on the Kube Scheduler's decisions, mounting volumes, setting up networking, and various other operations to manage Nodes for a Kubernetes cluster. The Kubelet will expose many metrics related to the local host's Pods, volumes, running operations, latency, Pod launch times, etc. The comprehensive metrics collection provides clear visibility for each Worker Node's status in the cluster. Observing discrepancies for metrics like Pod launch times and latency can indicate an issue with the Worker Node. Comparing metric values among a fleet of worker nodes helps identify outliers where issues occur. Kubelets also expose logs that record events for Node-related activities like Pod creation. The logs are vital when troubleshooting problems related to Pod creation failures, issues with mounting volumes, network initialization issues, etc.

Since Worker Nodes are complex components with many moving parts (compute instance, operating system, and surrounding AWS infrastructure like EBS volumes, Security Groups, etc), ensuring metrics and logs are collected is important for troubleshooting Node-related problems.

Addons

Any addons installed in the EKS cluster will also emit metrics and logs. Every cluster will likely have a variety of addons installed to extend the cluster's functionality, like Kubecost, Istio, Cilium, ArgoCD, Ingress Controllers, etc. Each addon will expose Prometheus metrics and log files, which will be valuable for troubleshooting and analysis. Since addons involve modifying significant aspects of a cluster's functionality, ensuring that appropriate monitoring is enabled for addons is essential. Addons should only be enabled in a production cluster once administrators have validated that log aggregation is working as expected and the relevant metrics dashboards and alerts (if required) have been configured appropriately.

Surrounding infrastructure monitoring

EKS clusters typically rely on infrastructure beyond the control plane and Worker Nodes; other AWS infrastructure dependencies for everyday use cases include load balancers, EBS volumes, databases, and other AWS service resources. Monitoring dependencies is required for complete visibility of the cluster's health; any problems occurring in a dependency may impact the cluster and its workloads and, therefore, must be considered when setting up monitoring. Many AWS services, like EBS volumes and load balancers, will emit metrics and logs to provide visibility into the service's health.

How to gather EKS monitoring requirements

Selecting appropriate tools will require administrators to understand their monitoring requirements. Here are four critical questions to answer to help find the right solution given a set of business requirements:

  • Is a managed service suitable, or is the flexibility of a self-hosted solution preferred? The trade-off is that managed services typically reduce operational overhead but cost more and are less flexible. Self-hosted solutions require administrators to manage the solution but provide greater flexibility when configuring the solution (e.g., metric retention time). Knowing the environment requirements and the available engineering resources will help you decide between a managed or self-service solution.
  • What are the required log and metric retention times? Organizations with compliance requirements may need higher retention times for monitoring data. This could narrow the available options. For example, AWS Managed Prometheus currently allows a 150-day retention time, making it unsuitable for organizations requiring longer retention times. Prometheus integrated solutions like Thanos can be self-hosted and have high availability and longer retention times.
  • What are the Kubernetes high-availability (HA) requirements? Managed services are typically HA, while self-hosted solutions will require additional overhead to implement HA capabilities. Determining how much availability is needed (or how much downtime is acceptable) can help narrow down the options.
  • What is the risk related to vendor lock-in and multi-cloud compatibility? Organizations that want to avoid vendor lock-in may prefer to reduce their reliance on AWS or other vendor-specific solutions and lean towards open-source projects that can be run in multiple environments. Aligning with a single vendor provides easy integration and familiarity. At the same time, vendor-agnostic solutions allow more freedom to move between platforms (for example, from EKS to another managed Kubernetes service).

There may be many more things to consider, and administrators will benefit from analyzing why they intend to implement a monitoring solution. Understanding the "why" will help guide what capabilities the administrator requires from the solution.

Some examples of monitoring solutions are discussed below, and many more options are available in the Kubernetes ecosystem. Since the available options can be overwhelming, spending time on use case analysis is critical to selecting an appropriate choice.

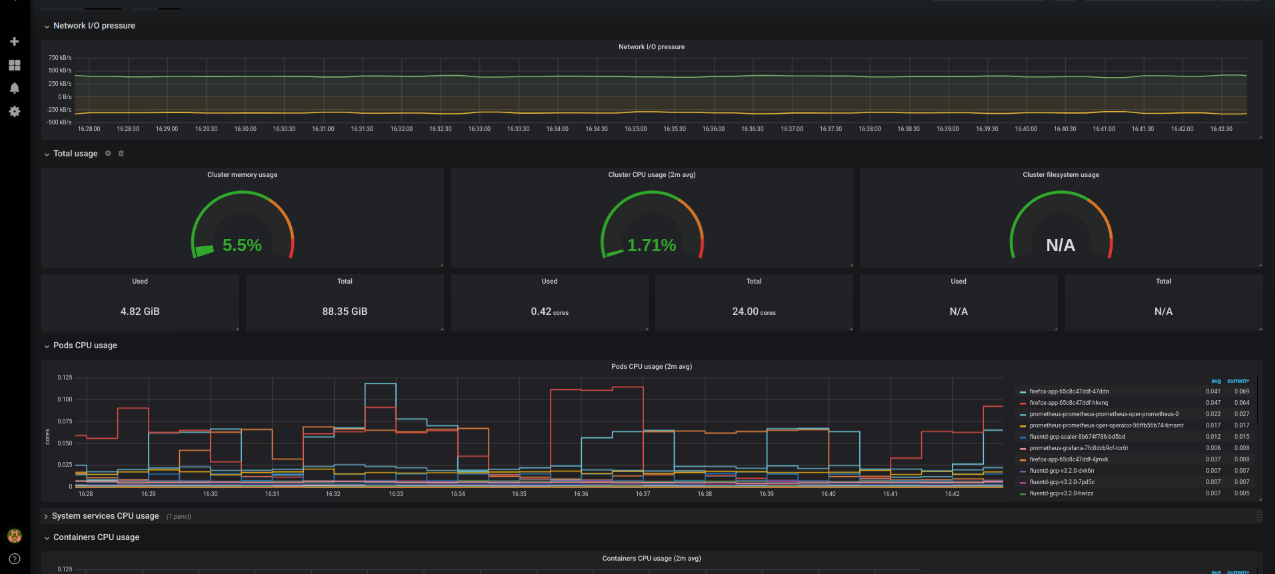
A Grafana dashboard with various widget formats to suit the metric type.

The drawback for Grafana is similar to Prometheus; administrators need to operate the Grafana project manually, which involves ongoing operational overhead. Operational activities will include backing up dashboard configurations, managing user pools and authentication, and enabling high-availability.

AWS Managed Prometheus and Managed Grafana

AWS offers managed services for Prometheus and Grafana, allowing users familiar with the open-source projects to leverage the benefits of a managed solution. The services involve delegating the storage and access to metrics and dashboards to AWS, reducing the requirement for administrators to maintain and operate local tools in their EKS clusters.

The managed Prometheus service involves setting up a slimmed-down Prometheus agent in the EKS cluster whose responsibility is to scrape cluster metrics and forward them to AWS. There is no local metrics storage in the cluster, so operations like implementing high-availability backups and optimizing query performance are no longer necessary. However, the drawback is that AWS will severely limit the functionality of the managed Prometheus implementation. For example, metric retention is limited to 150 days, the Prometheus software version cannot be controlled, and will lag behind the latest upstream release, and pricing can be complicated to evaluate since there are data transfer and query costs.

Grafana Loki

Grafana Loki is an open-source log aggregation project that will feel familiar to users of Prometheus and Grafana. Loki is designed for scaling horizontally, allowing easy HA capabilities and backups to object storage like AWS S3, and has a familiar design to Prometheus and Grafana. The query language is similar to Prometheus, and the dashboard experience is similar to Grafana. It's an advanced tool capable of handling high-volume log ingestion.

The drawback is that the query language has a learning curve, which may challenge new users. Here’s an example of a Loki query:

{container="query-frontend",namespace="loki-dev"} |= "metrics.go" | logfmt | duration > 10s and throughput_mb < 500


As a self-hosted solution, administrators must account for operational overhead like installation, upgrades, configuration optimization, disaster recovery, etc.

Learn how to manage K8s costs via the Kubecost APIs

DataDog, New Relic, SysDig, and other SaaS providers

There are many Software-as-a-Service (SaaS) providers offering monitoring capabilities for EKS. While each service will have its own strengths and weaknesses, the overall benefits and drawbacks will be similar.

The benefit of a SaaS solution is they typically offer an all-in-one approach to monitoring. Rather than installing multiple separate tools to handle metrics, logs, and traces, many SaaS providers will allow the collection of all types of data from a single tool installed in the cluster. This simplifies administrative responsibilities and provides a good user experience by enabling users to view all cluster-related data from a single interface rather than disparate tools. SaaS providers typically offer out-of-the-box setups for common log queries, alerts, and standard dashboards to enable users to get started on their platforms quickly. Access to support will also be available to access expertise when necessary.

The drawback can be costs; since SaaS providers are managing the backend infrastructure for data aggregation, storage, backups, etc., these capabilities will have an associated cost. SaaS solutions are generally not portable, so vendor lock-in may be an issue for administrations who prefer portability. Administrators must evaluate the trade-off between the benefits and drawbacks to determine if SaaS solutions are appropriate for their use case.

Alert Manager

Alert Manager is included in the Prometheus project but can be used as a standalone tool. It integrates with Prometheus to generate alerts based on metric data, such as thresholds being breached for a defined period. It can forward alerts to tools like PagerDuty and Slack. The native integration with Prometheus is the biggest selling point for this project. The community support and strong developer community are significant advantages compared to proprietary alerting tools.

A drawback of a self-hosted alerting tool is that if the cluster malfunctions in a way that impacts Alert Manager, the failure alerts themselves will be stuck. For example, administrators may want an alert if Pods are encountering DNS resolution issues, and failing to process application requests due to this issue. Suppose the DNS issue also affects Alert Manager (such as crashing CoreDNS Pods). In that case, Alert Manager will fail to function, and the administrator will not receive an alert about their broken cluster. This is a significant downside to running alerting tools from within the cluster that is being monitored. Typical mitigations for this scenario are to run Alert Manager externally (like on other clusters, where each cluster monitors the other) or leverage managed SaaS providers to alleviate the single point of failure.

Kubecost

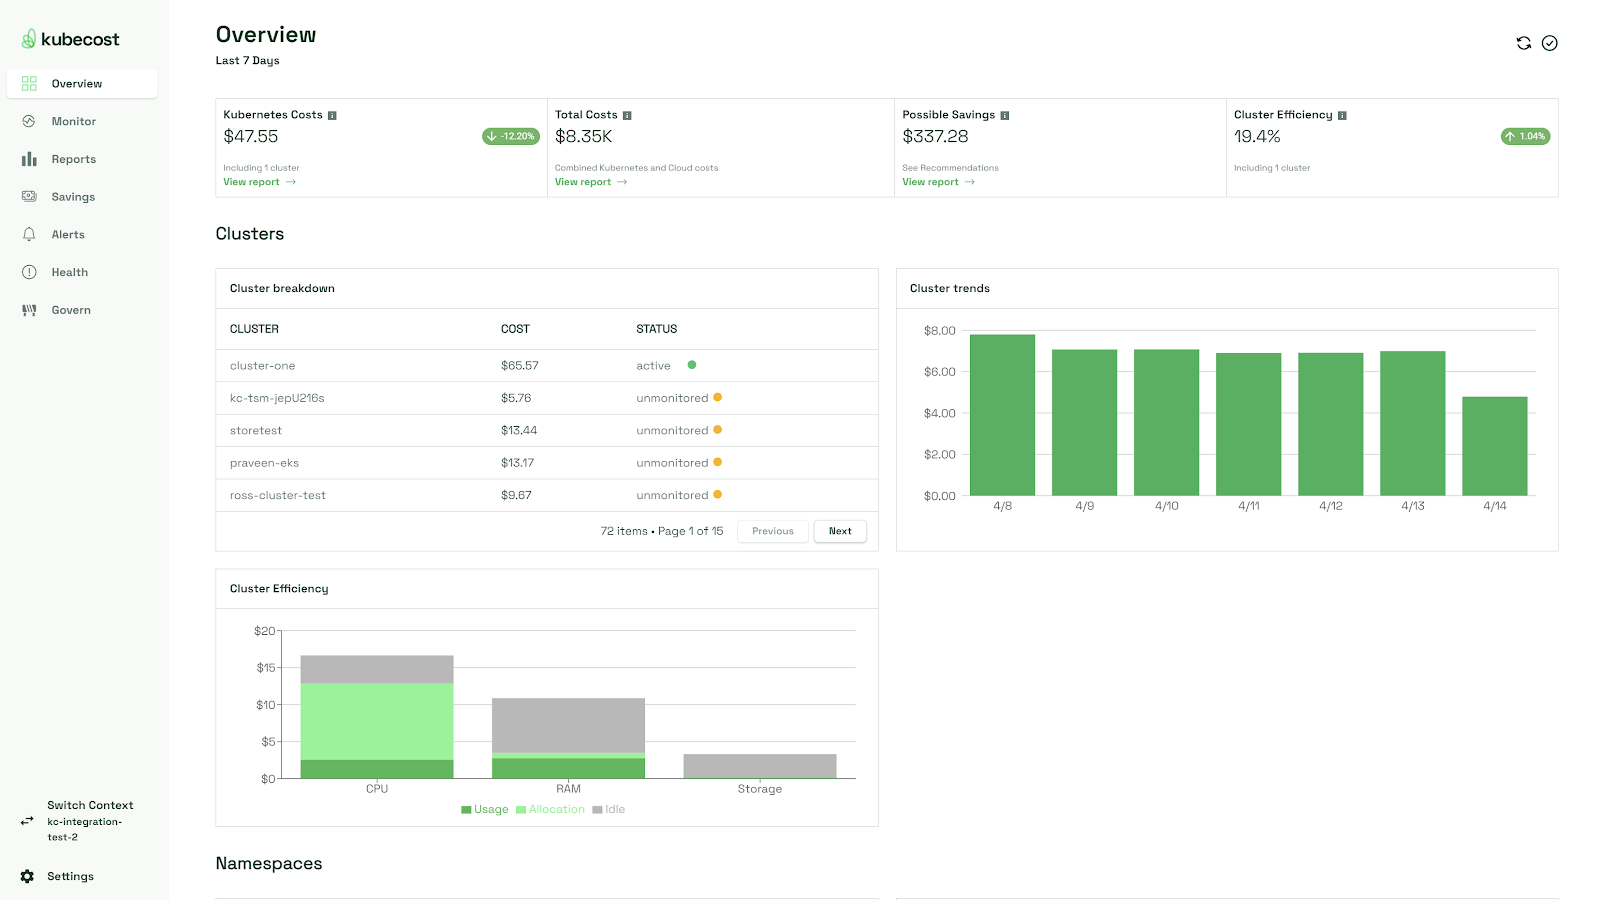
A key aspect of monitoring a Kubernetes cluster is gaining insight into costs. Visibility into costs can be a challenge in microservice environments with many moving parts, many cluster infrastructure components, and potentially multiple tenants sharing the same clusters. Tracking cost utilization of Pods, Nodes, storage, etc, is unavailable from tools like Prometheus. Kubecost is an example of a tool that provides real-time cost visibility for AWS infrastructure, allowing the tool to correlate workload utilization with cost projections accurately.

The above image shows the Kubecost dashboard, with details about current costs, trends, and resource efficiency.

Kubecost allows administrators to break down their cluster's resource expenditure based on namespace, workload, labels, etc., to enable transparency in cost allocation. Alerts can also be enabled to warn administrators when costs exceed expected thresholds, which helps prevent misconfigured resources from overconsuming the desired budgets. The tool can also provide optimization recommendations by analyzing allocated resources versus utilization, giving administrators insight into workloads that can be rightsized for cost savings.

5 EKS monitoring security best practices

Administrators should consider a few critical best practices when implementing a monitoring setup to maintain security.

Analyze cluster audit logs

Audit logs provide insight into who is accessing the cluster and what objects are being viewed and modified. This information is valuable for incident analysis, proactively alerting on potential security breaches, and monitoring if workloads in the cluster are behaving correctly. Setting up IAM controls to limit the ability to delete the control plane logs can help avoid accidental or malicious deletion of this data. Setting up alerts based on suspicious activity in the audit logs, such as monitoring changes to the aws-auth ConfigMap, may also be helpful.

The below CloudWatch Logs query will show Audit events for any changes made to the aws-auth ConfigMap:

fields @logStream, @timestamp, @message
| filter @logStream like /^kube-apiserver-audit/
| filter requestURI like /\/api\/v1\/namespaces\/kube-system\/configmaps/
| filter objectRef.name = "aws-auth"
| filter verb like /(create|delete|patch)/
| sort @timestamp desc
| limit 50

Implement storage access controls

Metrics and log data are sensitive information. Control plane logs provide complete insight into all cluster workloads and operations, allowing an attacker to understand exactly what's deployed in the cluster. Logs from applications deployed to the cluster may contain sensitive data, like customer information. Any monitoring setup will require locking down unnecessary access to data. Only administrators or personnel who require access should be granted monitoring data, and the access should be scoped to the specific data required (for example, logs from particular Pods). Most monitoring tools will allow configuring access control settings.

Enforce data retention policies

Data retention policies are crucial for compliance and maintaining a balance between availability and security. Retaining logs and metrics for too long can pose a security risk, while not retaining them long enough can hinder your ability to investigate past incidents.

Encrypt data at rest and in transit

Data encryption at rest and in transit ensures that the data remains protected even if unauthorized access occurs. Most monitoring tools will offer options for configuring retention and encryption settings.

Utilize Kubernetes-native security controls

Kubernetes provides many ways to enforce security in the EKS cluster. These controls will be leveraged to protect access to any monitoring components deployed to the cluster. For example, role-based access control (RBAC) should be configured to restrict access to modifying monitoring tools. Pod Security Standards and Pod Security Admission can be leveraged to tighten the cluster's security further, helping to mitigate problems like Pods with root access compromising Worker Nodes containing monitoring components. Many more tools are available for enforcing security in a Kubernetes cluster (like OPA Gatekeeper), and implementing security controls is important for protecting the integrity of the monitoring components and their datasets.

Conclusion

In this article, we've learned about several essential aspects of monitoring EKS clusters.

Effective monitoring involves understanding the value of logs, metrics, alerts, traces, and visualizations. Each of these items contributes to providing administrators with a complete monitoring solution.

Once the core monitoring concepts have been understood, the next step is to consider what resources of an EKS cluster can be monitored and the data each component can provide. The data types exposed by the control plane, worker nodes, and pods must be considered when enabling monitoring capabilities.

Administrators should determine use case requirements before considering suitable monitoring tools. A critical requirement is to determine whether a managed solution's lower operational overhead is preferable or if the flexibility of a self-managed solution is more appropriate. This will impact the category of monitoring tools that fit the use case. An extensive range of managed and open-source solutions are available, and a deep understanding of your use case will enable an accurate selection. Regardless of which tools are selected, implementing security best practices will always be required due to the sensitive nature of observability data like logs.

After carefully evaluating your EKS monitoring requirements and experimenting with available tools, implement a solution that works for your business requirements, but don't stop there. Experimentation and continuous improvement are essential. Teams should regularly evaluate their business needs and tooling to address them adequately.

Comprehensive Kubernetes cost monitoring & optimization

Continue reading this series