Learn the best practices for how to set up a comprehensive monitoring and alerting framework for your Kubernetes clusters.

Kubernetes: Monitor and Alerting Best Practices

Kubernetes has become the standard platform for deploying and managing containerized applications. Its powerful features, such as self-healing and automatic scaling, make it an attractive choice for dynamic workloads. However, these benefits come with challenges that make monitoring Kubernetes clusters more complex.

One significant challenge is that containers and pods can be created and destroyed as part of a typical application lifecycle. This behavior makes it difficult to track the state of your applications using traditional monitoring tools. Additionally, the abstraction layers in Kubernetes can block insight into the underlying infrastructure, making it harder to diagnose performance issues or resource bottlenecks.

Another challenge is the volume of metrics and logs generated by a Kubernetes cluster. With multiple microservices communicating across various nodes, identifying the root cause of an issue requires comprehensive monitoring and tools capable of working with distributed environments.

Unaddressed challenges can lead to undetected failures, performance degradation, and security vulnerabilities. Implementing a monitoring and alerting strategy is beneficial and, in fact, essential for ensuring the reliability and efficiency of your Kubernetes deployments.

This article explores five best practices for Kubernetes monitoring and alerting. These practices are designed to help you navigate the complexities of Kubernetes environments, providing the insights needed to maintain optimal performance and quickly address any issues.

Summary of Kubernetes monitoring and alerting best practices

Best practice Description
Monitor resources Track CPU and memory usage at the node and container levels to ensure cluster performance and avoid resource exhaustion.
Implement log aggregation Collect and centralize logs from all pods and nodes to simplify analysis, troubleshooting, and auditing.
Monitor cloud costs Track and allocate cloud expenses to specific departments, teams, or workloads to optimize spending and manage budgets effectively.
Set up proactive alerting Identify important metrics and configure alerts to notify the team of potential failures or performance or security issues.
Visualize your data Create visual dashboards that provide real-time insights into key metrics, enabling quick decision-making and at-a-glance assessments of cluster health.

How to build a comprehensive monitoring framework

To keep your Kubernetes cluster healthy over the long term, you need to monitor the various aspects of it. A comprehensive framework will offer deep insights into every aspect of the cluster. It should monitor resource utilization and aggregate logs to a central location. It should keep track of costs across teams and be able to alert on any of these metrics. If you are using microservices, it should be able to trace requests through your environment. Finally, all of this should be accessible through visual dashboards, so your teams can see what is happening at a glance.

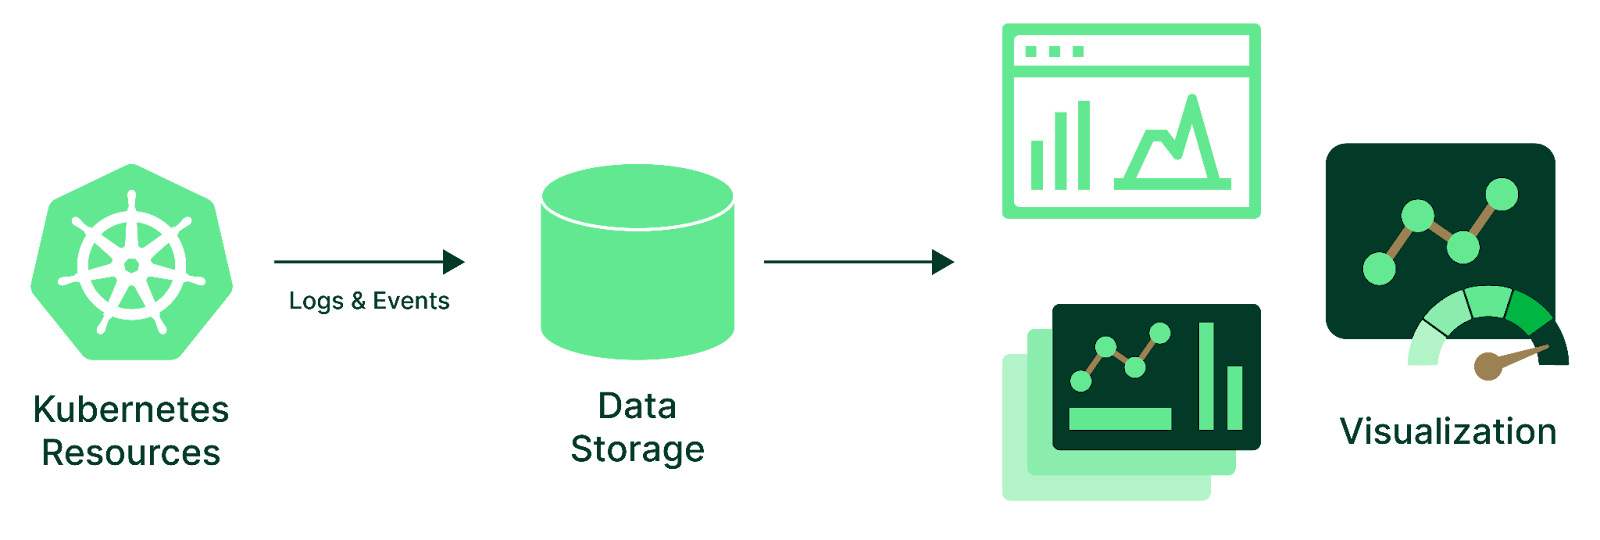
The diagram below shows the general flow of generated logs and events to a visualization dashboard.

Kubernetes metrics flow: from raw resources to data storage and visualization

Monitor resources

Achieving optimal resource utilization requires an understanding of how Kubernetes uses resources, and the first step to monitoring resource utilization is defining your monitoring requirements. For any metrics, you must address two primary questions: What should you monitor, and how often should you monitor it?

Implementing effective resource utilization monitoring involves a focus on the “big three”:

  • CPU: Continuous monitoring of overall CPU usage is essential. Delve into per-pod/container breakdowns, observing metrics like average usage, peak utilization, and occurrences of throttling. Analyzing these metrics aids in identifying resource-hungry workloads or potential performance bottlenecks.
  • Memory: Monitoring memory usage is needed to prevent out-of-memory issues. In the event of memory exhaustion, the system may resort to terminating processes, potentially leading to broader outages.
  • Storage: Track storage utilization, including persistent volumes and ephemeral pod storage. Understanding these metrics helps optimize storage resources and detect possible storage-related constraints.

Some of the most popular monitoring solutions are Prometheus, Node Exporter, and cAdvisor. These tools each play a role in monitoring resource utilization on your nodes and containers:

  • Prometheus is an open-source monitoring and alerting toolkit. It collects metrics at specified time intervals from specified targets and stores them in a time-series database. Prometheus is a good base because you can integrate add-ons such as Alert Manager (which we will discuss later) and scrape custom metrics from your application.
  • Node Exporter is an add-on to Prometheus that exposes metrics at the individual node level. In Kubernetes, these are metrics on your control plane and worker nodes, which Prometheus scrapes. Node Exporter runs as a DaemonSet in the cluster.
  • cAdvisor also runs as a DaemonSet in a Kubernetes cluster. This means that one instance of cAdvisor runs on each node and collects/exposes container metrics. Prometheus can then scrape these metrics.

Prometheus, Node Exporter, and cAdvisor collectively represent a comprehensive monitoring solution for Kubernetes clusters. Applications can generate custom metrics to meet specific monitoring needs. Users can leverage Custom Metrics APIs to expose and fetch these custom metrics, allowing for more customized monitoring and management.

In general, setting up custom metrics involves two steps:

  1. Instrumenting the client application.
  2. Configuring Prometheus to scrape metrics.

Illustrated below is an example in Node.js, where a custom metric named my_app_cpu_usage is exposed:

const express = require('express');
const prometheus = require('prom-client');

// ...rest of the code...

// Define a custom metric
const myAppCpuUsage = new prometheus.Gauge({
  name: 'my_app_cpu_usage',
  help: 'Custom metric for CPU usage in the app',
});

// Simulate CPU usage increase
setInterval(() => {
  const randomCpuUsage = Math.random() * 100;
  myAppCpuUsage.set(randomCpuUsage);
}, 5000);

// Expose metrics endpoint
app.get('/metrics', (req, res) => {
  res.set('Content-Type', prometheus.register.contentType);
  res.end(prometheus.register.metrics());
});

After exposing APIs from your service, configure Prometheus to scrape the relevant endpoints and collect metrics from your application.

Implement log aggregation

Since Kubernetes is a distributed system, logs are generated from multiple sources, such as nodes, system services, and individual containers. Log aggregation in Kubernetes centralizes logs from all pods, nodes, and system components into a single location, making monitoring, troubleshooting, and auditing your cluster easier.

Instead of manually checking logs on individual nodes or pods, log aggregation tools collect and store logs in a unified system, enabling you to search, filter, and analyze logs in real time. Having all the logs in one place ensures that you can identify issues quickly, ensure compliance, and maintain operational visibility across your environment.

Much like collecting and analyzing metrics, a few tools come together to establish a toolkit. Let’s look at the roles these tools fulfill.

Note that the ELK stack (for Elasticsearch, Logstash, and Kibana) is a commonly deployed toolset, but the combination of Loki, Promtail, and Grafana is becoming more popular. The key point to remember is that each tool plays a specific role in the log aggregation process.

Comprehensive Kubernetes cost monitoring & optimization

Log collection

These tools collect, process, and forward the logs from the nodes and containers to centralized storage:

  • Logstash is a powerful tool for collecting and processing logs. It is known for handling more complex data transformations and supports additional plugins.
  • Fluentd is lightweight and designed for cloud-native environments like a Kubernetes cluster. It also supports plugins but does not have the same data transformation capabilities, such as if-else conditions.
  • Promtail is a log forwarder specifically designed for Loki. It is very lightweight and is primarily used to forward logs. If you are already using Prometheus, it integrates nicely.

Log storage

Log collection tools forward the logs to a storage system, which stores them for analysis:

  • Elastichsearch serves as centralized log storage and provides full-text search capabilities.
  • Loki is a lightweight log storage tool. It stores the logs in a compressed, index-free format, which makes it less resource-intensive. However, it lacks features like full-text search.

Log visualization

These tools help visualize the log data:

  • Kibana is a tool for visualizing and querying logs. It provides a web-based interface where you can create dashboards to monitor trends.
  • Grafana is often used as the visualization component for Prometheus metrics. Loki integrates well with Grafana.

Monitor cloud costs

Running Kubernetes clusters can be a cost-effective way to deploy and manage your applications. However, costs can quickly spiral out of control without proper monitoring and optimization. Cost monitoring in Kubernetes helps track and optimize resource usage so you can control expenses in your cloud environment.

Cost monitoring tools analyze how applications consume resources like CPU, memory, and storage, providing insights into where money is being spent. This allows you to identify inefficiencies, such as overprovisioned resources or underutilized infrastructure, and take corrective actions to reduce costs.

Cost monitoring ensures that your Kubernetes cluster runs efficiently and stays on budget. Popular tools for cost tracking, such as Kubecost, offer detailed reports, actionable recommendations, and the ability to alert on thresholds.

Granular cost visibility

Here are some considerations to keep in mind:

  • Resource-level cost attribution: Employ tools like Kubernetes cost management platforms and cloud provider native cost explorers to delve deep into resource usage across individual pods, workloads, and services. These tools provide detailed breakdowns of cloud spending across services, projects, and teams.
  • Multi-cloud support: When dealing with deployments across multiple cloud providers, ensure that your cost-monitoring strategy covers all environments. For instance, if you’re using AWS and Azure, having a unified monitoring tool that provides a comprehensive view of expenses across both platforms can help make informed decisions by comparing cloud costs and optimizing deployments accordingly.
  • Cost allocation using labels and namespaces: Implement a rigorous resource tagging strategy to assign cost ownership to specific teams, applications, or projects. Granular tagging enables targeted cost analysis and accountability. For example, you might tag resources with labels like team=marketing or app=backend to associate costs with specific areas.

Implement resource quotas

Implement resource quotas within namespaces to limit the maximum amount of CPU, memory, and storage consumed by resources within that namespace. For example, you could set a maximum limit of 4 CPU cores and 8 GB memory for a namespace hosting non-critical services.

apiVersion: v1
kind: ResourceQuota
metadata:
  name: cpu-mem-quota
spec:
  hard:
    cpu: "4"
    memory: 4Gi

Limit range

Define default resource limits for pods within a namespace to avoid overconsumption. Example:

apiVersion: v1
kind: Pod
metadata:
  name: limitrange-cpu
spec:
  containers:
  - name: demo
    image: registry.k8s.io/pause:2.0
    resources:
      requests:
        cpu: "200m"
      limits:
        cpu: "700m"
K8s clusters handling 10B daily API calls use Kubecost

Set up budgets

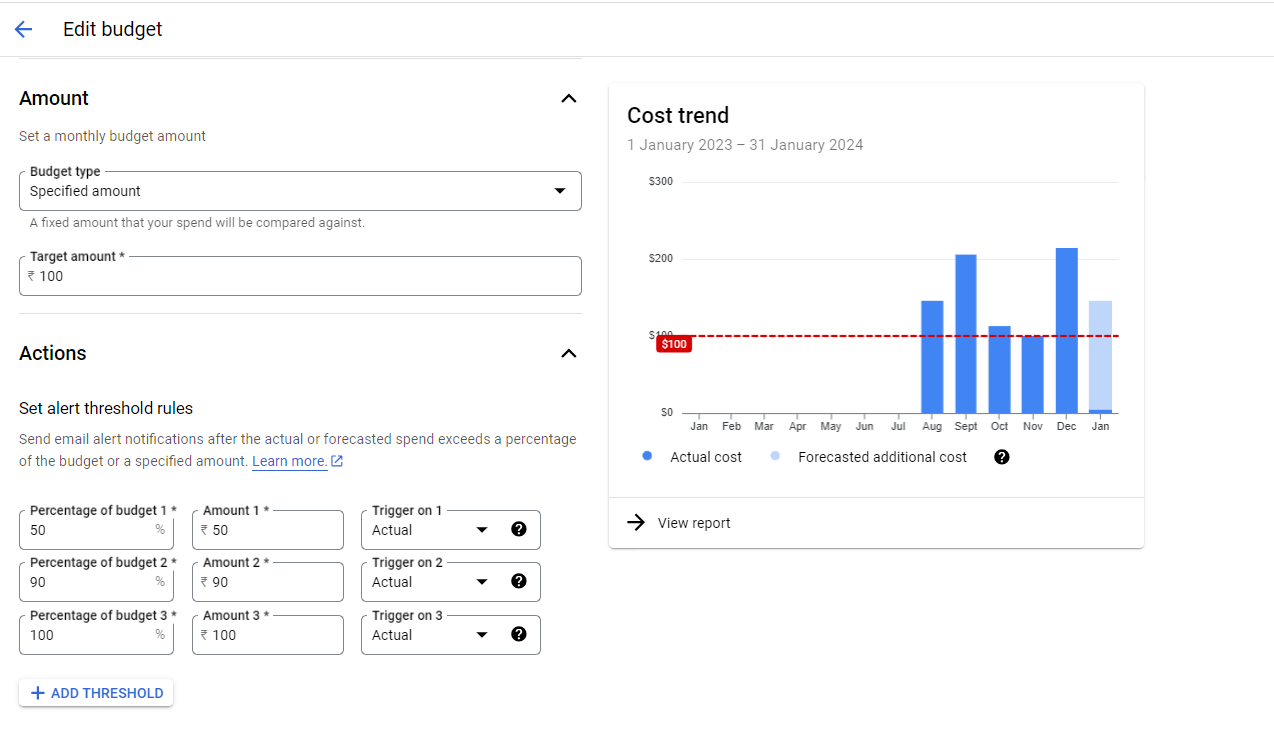
Establish spending limits for Kubernetes deployments within your chosen cloud provider platform (such as AWS Cost Explorer, GCP Billing, or Azure Cost Management). Alerts will signal approaching budget exceedances, prompting proactive measures to optimize resource utilization or scale down deployments.

Illustrating the budget feature in GCP, displaying customizable limits to monitor expenses within the platform

Real-time cost monitoring and alerts

Real-time cost monitoring involves tracking resource usage and associated costs as they occur. While many cloud platforms offer native cost monitoring features, they might lack certain functions necessary for comprehensive monitoring.

To fully address these shortcomings, leveraging robust third-party solutions such as KubeCost can be highly useful. Here are some of the features that a tool like KubeCost provides:

  • Continuous cost tracking: Implement real-time cost monitoring to track resource consumption and associated costs as they occur. This enables proactive cost management and making informed decisions to optimize resource allocation. This might involve using third-party tools that provide cost insights specific to your cloud provider or building custom solutions.
  • Cost anomaly detection: Setting up alerts for abnormal cost deviations or sudden resource spikes is crucial. This involves defining thresholds based on specific cost metrics and historical data. For instance, you might trigger an alert if a service’s hourly cost exceeds 10% of the average cost over the past week.
  • Customizable alerting: Customizable alerting allows for flexible thresholds and notification channels based on individual needs. This ensures appropriate escalation for critical cost issues while minimizing alert fatigue.
    For example, Slack or Microsoft Teams integrations can be used to receive immediate notifications when costs breach predefined thresholds, with severity-based alerts to different teams responsible for cost management.
  • Integration with CI/CD pipelines: Integrating cost monitoring into CI/CD pipelines helps identify and prevent resource-intensive deployments before they reach production. This involves implementing checks or automated scripts that analyze resource utilization metrics before deployment. Monitoring tools should be equipped to support such APIs.

    For example, integrate cloud-native monitoring tools (e.g., AWS CloudWatch or Azure Monitor) to collect and analyze resource utilization metrics. If the resource usage exceeds defined thresholds, it automatically halts the deployment process for further review.

  • Machine-learning-based cost optimization: Leverage machine learning models to predict resource needs and proactively adjust configurations for optimal cost efficiency. For instance, you can employ historical usage patterns to forecast future resource requirements and adjust resource allocations accordingly.

How Kubecost meets these needs

Kubecost offers a compelling solution to address the areas described above:

  • Unified platform: KubeCost consolidates real-time cost monitoring, granular resource allocation visibility, and sophisticated cost attribution into a unified platform. Unlike native cloud platform tools, KubeCost provides a holistic view of costs across Kubernetes clusters, eliminating the need for piecemeal solutions.

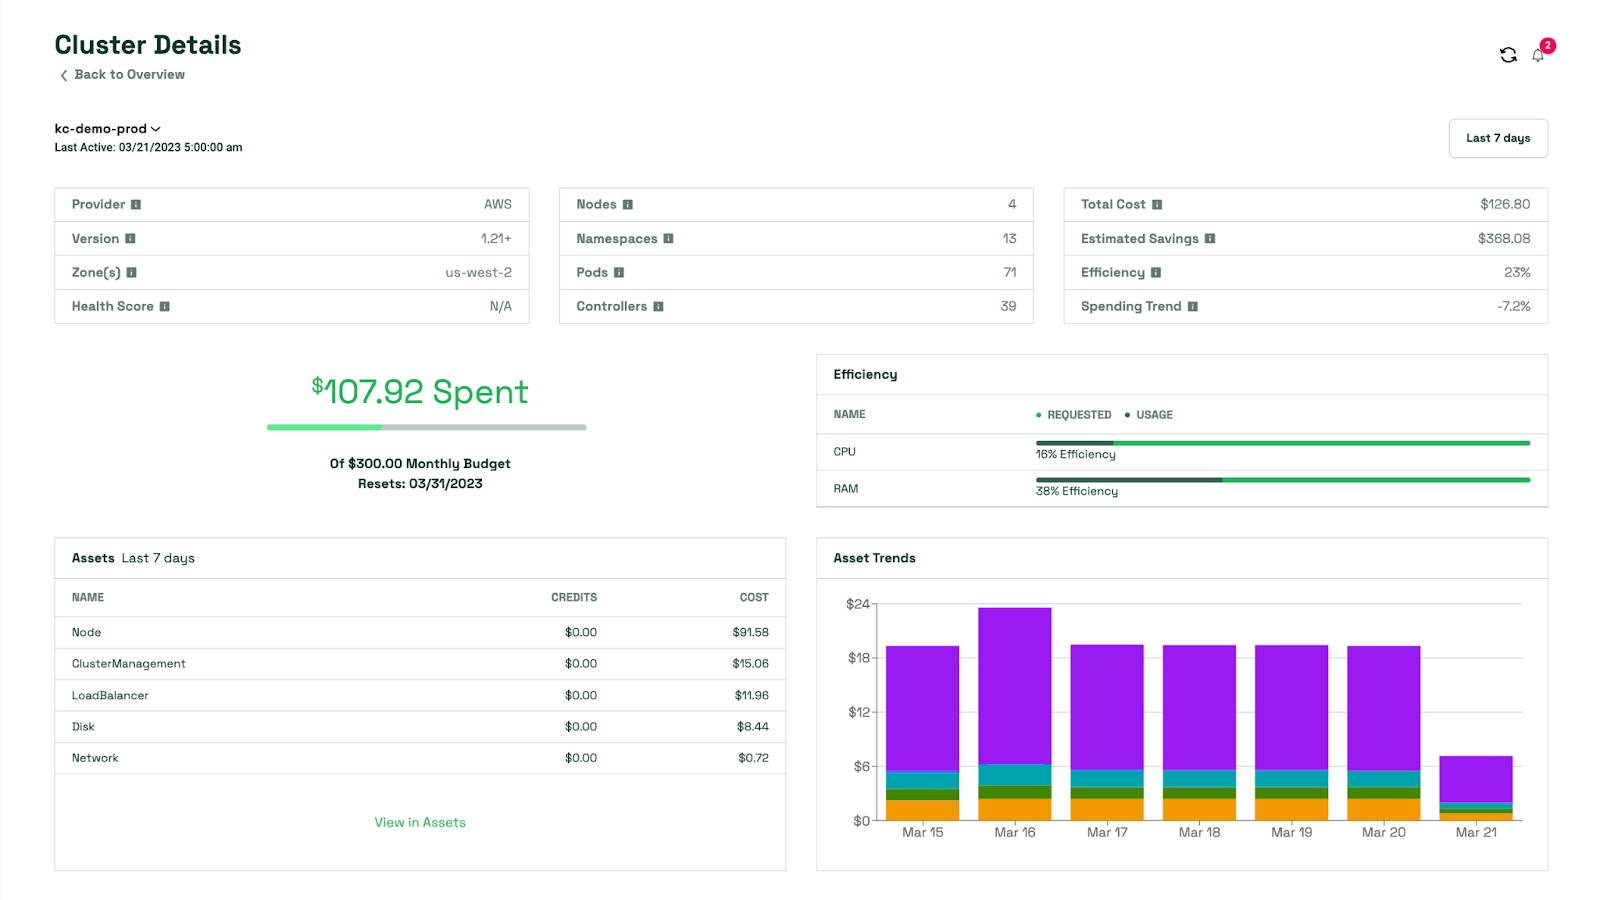
KubeCost’s Cluster Inspector view: A single-page snapshot showing costs, efficiency cluster details, etc.

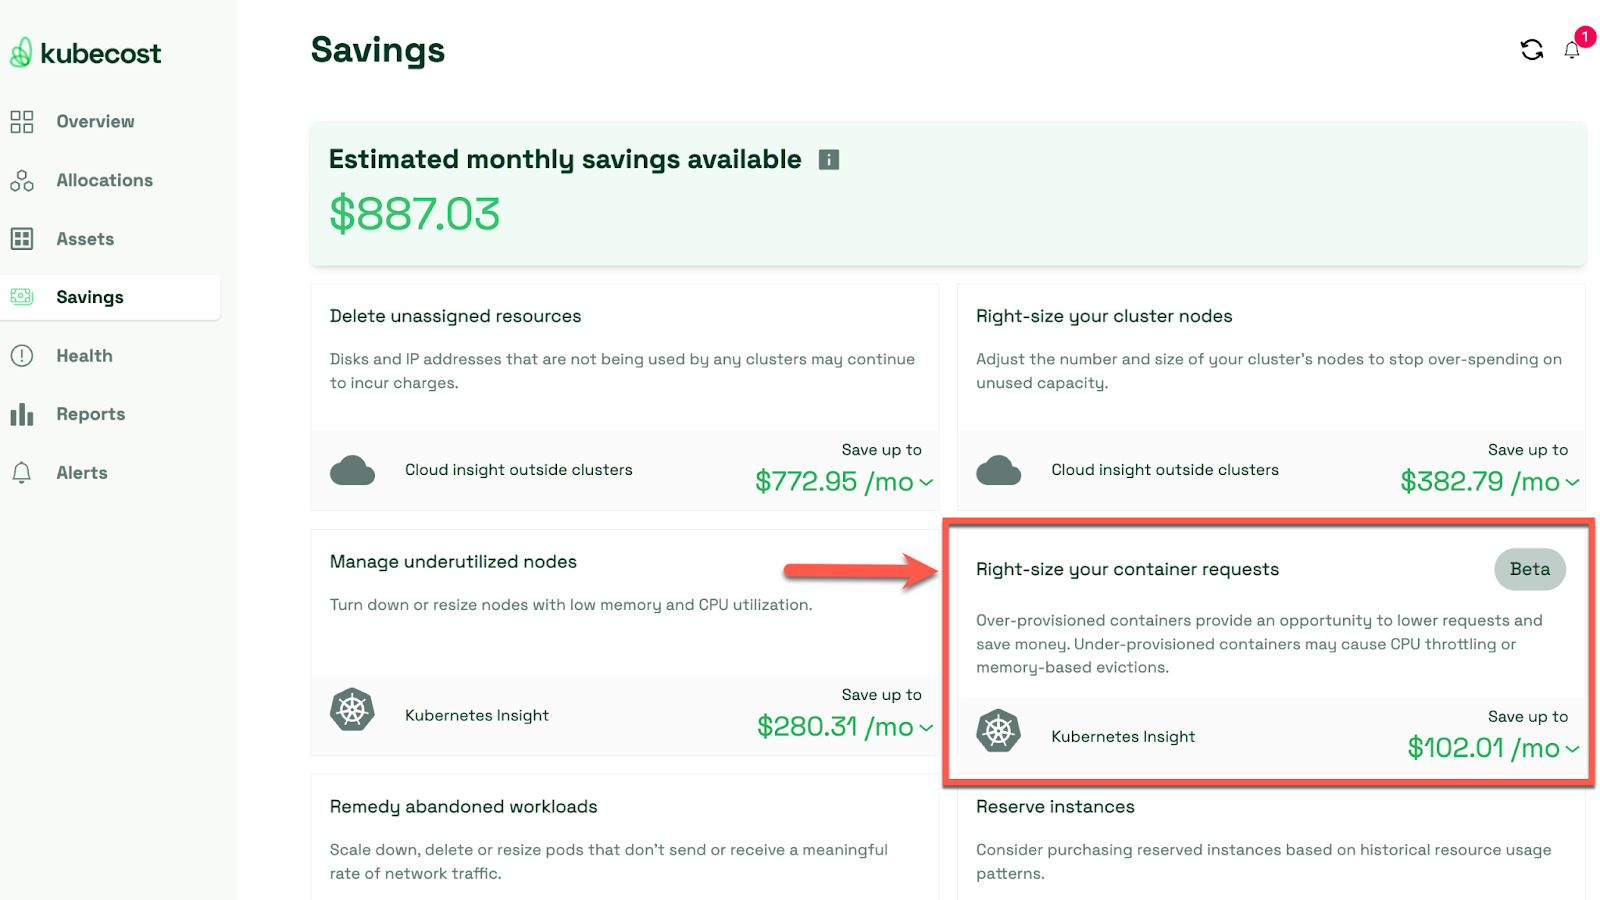
  • Optimization insights: KubeCost goes beyond conventional monitoring by offering powerful optimization insights aimed at enhancing resource efficiency and minimizing costs within Kubernetes clusters. The platform uses advanced analytics to identify and highlight potential areas for improvement, providing actionable recommendations to right-size resources.

The Kubecost Savings Dashboard displays anticipated cost reductions.

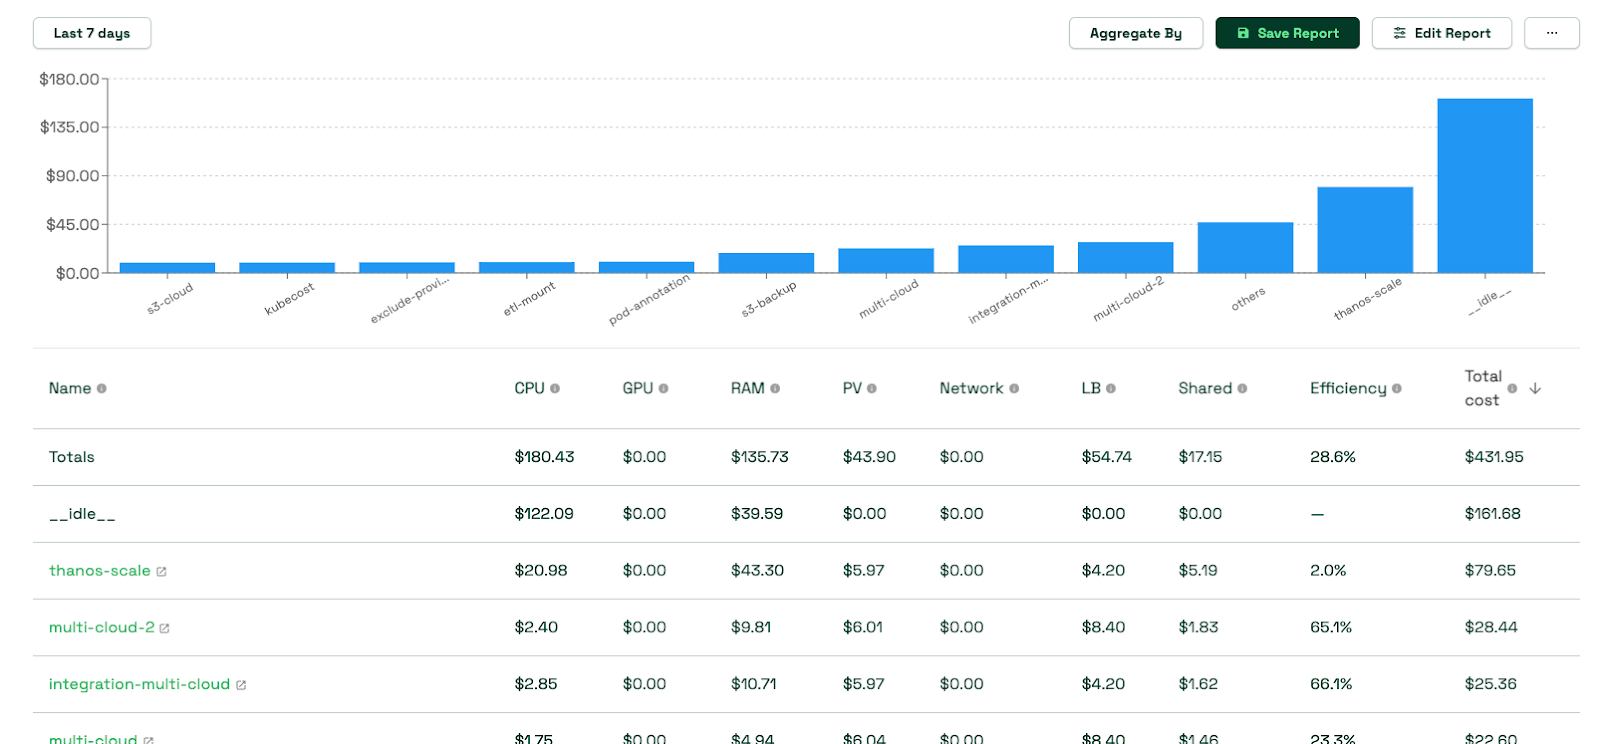
  • Efficiency analysis: KubeCost’s efficiency analysis tools identify inefficient resource utilization patterns. This enables organizations to right-size resources and minimize costs without compromising performance.

Kubecost’s allocations view provides insights into efficiency and idle time.

By implementing these cost monitoring and optimization strategies, you can gain control over your Kubernetes expenses, maximize the value of your investment, and ensure that their applications run efficiently and cost-effectively.

Set up proactive alerting

Effective alerting occurs when alerts are actionable and point directly to potential failures, performance issues, or security incidents.

One best practice is to set alerts based on sustained conditions rather than spikes. For example, instead of triggering an alert every time CPU usage briefly exceeds 80%, you should alert only if it stays above that threshold for a continuous period, such as three minutes. This reduces noise and ensures that you respond to real problems rather than temporary fluctuations.

In contrast, some alerts—especially those related to security, such as unauthorized access attempts—should trigger in real time to allow for quick action.

Tools like Alertmanager enable grouping related alerts, reducing duplicates, and routing them to appropriate channels like email, Slack, or PagerDuty.

Learn how to manage K8s costs via the Kubecost APIs

Focus on actionable alerts

Actionable alerts go beyond simply notifying you of an anomaly. They provide context-rich information and clear guidance on remediation, enabling swift and effective response. This includes:

  • Precise details: Identifying the affected resource (pod, node, namespace, etc.), the triggering metric (CPU usage, memory pressure, network latency, etc.), the current value and threshold breached, the time of occurrence and duration, and any relevant logs or events.
  • Prioritized urgency: Categorizing alerts based on their severity level (critical, high, medium, or low) to ensure immediate attention to the most pressing issues.
  • Direct actionability: Including specific steps or automated workflows for addressing the alert, maximizing response efficiency, and minimizing downtime.

Here are some examples of actionable alerts:

  1. Critical node down:
    • Alert title: “Critical Node Outage: Node-3 Unavailable”
    • Details: “Node-3 has been unreachable for 5 minutes. Impacted pods: nginx-deployment-7595465465, redis-6546545645. Triggering event: network connectivity loss.”
    • Action: “Initiate failover to the backup node. Investigate network connectivity issues.”
  2. High memory pressure on pod:
    • Alert title: “High Memory Usage: frontend-pod-5546546546 (95% Usage)”
    • Details: “frontend-pod-5546546546 is experiencing memory pressure exceeding 95% threshold for 10 minutes. Potential performance degradation.”
    • Action: “Review pod resource allocation. Consider scaling up resources or optimizing application memory usage.”

These alerts deliver granular details, pinpointing the affected resource and aiding root cause analysis through log data. Additionally, they recommend immediate actions, which help minimize downtime and streamline the response.

Several tools and techniques can be leveraged to implement actionable alerts:

  • Prometheus: Utilizing Prometheus Alertmanager enables potent rule-based alerting with flexible notification channels and rich contextual data integration.
  • Kubernetes events: Leveraging Kubernetes events offers resource-specific alerts and seamless integration with custom scripts or workflows for automated remediation.
  • Other third-party tools: Various third-party tools offer advanced alerting and specialized features such as alert routing, deduplication, escalation, suppression, and enrichment. This ensures that relevant information reaches the right stakeholders while minimizing alert fatigue and improving incident resolution times.

Define optimal alert parameters and thresholds

Setting meaningful alerts and thresholds for resource monitoring in Kubernetes, using Prometheus or a similar tool, is crucial for catching issues and optimizing resource utilization. Here are some considerations for some of the most essential resources:

  • CPU: Usage is expected to fluctuate over time. It could spike up to 100% for a short period without issue. High CPU usage becomes an issue when it is sustained at or above a set threshold for an extended period. An example of a reasonable alert threshold would be 80% CPU sustained over five minutes.
  • Memory: Monitor for memory leaks, which might look like steady growth in memory usage. Use load testing to determine your application's normal operating memory range and set the threshold above that range. A reasonable threshold for an alert might be closer to 90-95%, and when it’s been there for 1-2 minutes.
  • Network: There are numerous metrics you could monitor for network traffic. You should begin with ingress and egress traffic to understand traffic patterns. Once you have established patterns, create alert thresholds that represent anomalies in your environment. This can potentially identify DDoS attacks or a sustained traffic increase, which could translate to higher bandwidth costs.
  • Storage: When monitoring storage, you want to know how much is being used, how quickly it is being used, and how fast you can read/write to the system (IOPS). The first two metrics to consider are the overall usage of persistent storage and the rate of change in storage usage. Monitoring the rate of change alongside total usage helps identify potential issues. The third metric (IOPS) will help determine if there are any utilization issues or if disks need to be upgraded to keep up with demand.

Finding suitable thresholds requires a meticulous balance between historical context and real-time benchmarks. If your thresholds are often triggered without them being an issue, consider developing dynamic instead of static thresholds. We will discuss this in the next section.

Dynamic vs. static thresholds

Creating dynamic thresholds involves writing alerting rules that adjust their thresholds based on real-time or historical data rather than fixed static values. This approach allows your alerts to be more adaptable and reduces false positives caused by regular fluctuations in your metrics.

You could use Prometheus and its query language (PromQL) to create dynamic thresholds that adjust based on factors like the rate of change or comparing to the same time one day before.

For example,

groups:
- name: DynamicThresholds
  rules:
  - alert: CPUUsageHigh
    expr: |
      max_over_time(node_cpu_seconds_total{mode="idle"}[5m]) < 0.15
    for: 10m
    annotations:
      summary: "High CPU usage detected"
      description: "CPU usage exceeded 85% over the last 5 minutes."

Alerting based on change rates

Monitoring the rate changes of key metrics is crucial for proactively identifying potential issues. Implementing the Prometheus rate function aids in tracking these changes:

groups:
- name: RateChangeAlerts
  rules:
  - alert: CPUUsageSpike
    expr: |
      rate(node_cpu_seconds_total{mode="idle"}[5m]) > 0.3
    for: 5m
    annotations:
      summary: "Sudden CPU usage spike"
      description: "CPU usage increased by more than 30% in the last 5 minutes."

Use alert routing and escalation

Fine-tuning your alert routing and escalation strategy is crucial for a robust Kubernetes incident response. Here are some actions to take:

  • Implement tiered notification channels: Escalate alerts based on severity, using low-impact notifications for internal monitoring, SMS for critical issues, and even triggering automated remediation for specific situations.
  • Integrate with incident management tools: Integrate an alerting system with incident management platforms like PagerDuty for automated alert ticketing, incident assignment, and collaborative resolution workflows.
  • Utilize alert silencing: Define temporary mechanisms for planned maintenance activities or expected fluctuations. This is particularly useful during periods of planned maintenance or upgrades when you know specific alerts will be triggered but are not indicative of a problem.

By implementing these strategies, organizations can ensure that critical alerts reach the right people, fostering a rapid and efficient response to any Kubernetes incident.
Visualize your data

A monitoring stack’s visualization layer is the easiest way to derive insights and understanding from the collected metrics.

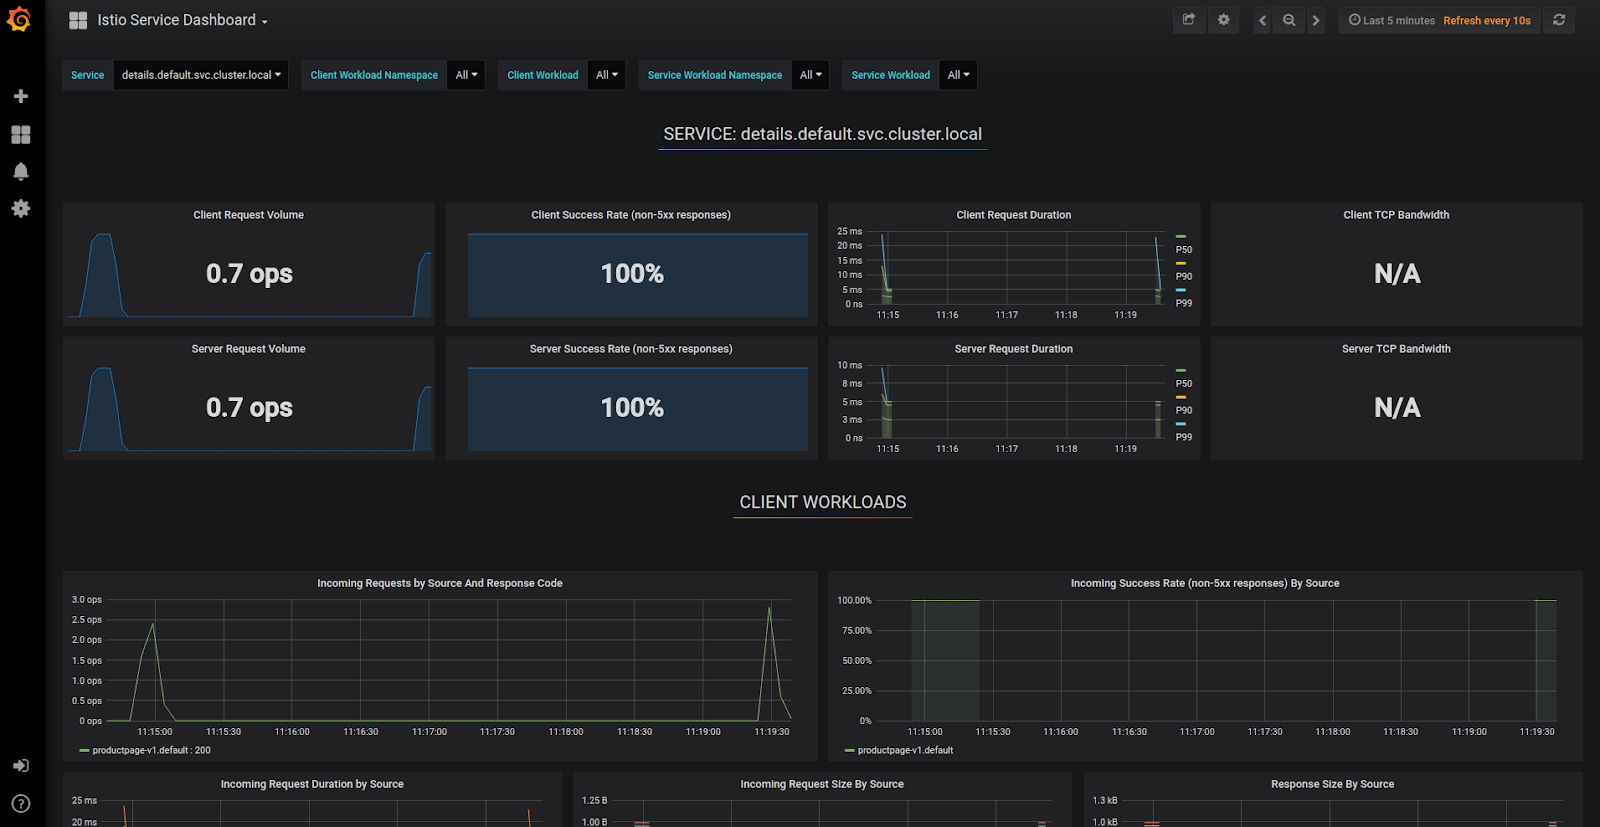
Use tools like Grafana to create visually intuitive dashboards. When integrated with Prometheus or other data sources, Grafana allows custom dashboards to be created that provide real-time insights into the Kubernetes cluster's health, resource utilization, and application performance. These dashboards can be tailored to display metrics crucial for monitoring and diagnosing issues.

Image illustrating a Grafana dashboard, displaying custom charts for key performance metrics.

Gaphana and other visualization tools can leverage pre-build dashboards, which are great when you are getting started and trying to understand your data.

Conclusion

Setting up effective monitoring and alerting for your Kubernetes environments is the key to maintaining your cluster and applications’ reliability, performance, and security. The distributed and ephemeral nature of Kubernetes introduces challenges that require a comprehensive and proactive monitoring solution.

This article's five best practices—resource utilization, aggregating logs, monitoring cloud costs, setting up proactive alerting, and using visual dashboards—will provide deep insights into your cluster’s health and application performance. These practices empower you to identify and address issues quickly and optimize resource usage.

As Kubernetes continues to evolve and your workloads grow, regularly reviewing and updating your monitoring strategies will be vital. Stay on top of your costs with Kubecost and keep informed about new tools and techniques. Involve your team in continuous improvement and prioritize monitoring as a key aspect of your Kubernetes operations. Doing so will ensure that you are ready to handle the challenges of cloud-native application deployment, maintain optimal performance, and deliver reliable services to your users.

Comprehensive Kubernetes cost monitoring & optimization

Continue reading this series